
Large Software Projects: Monitoring Dashboard
Posted on November 2, 2025 • 7 minutes • 1454 words • Other languages: Español
This post is part of my Large Software Projects blog series .
- Code Source
- Dependencies
- The Node.js Runtime Environment
- Next.js Instrumentation
- Environment Variables Setup
- /api/metrics
- Logger Demonstration
- Monitoring Stack Setups
- Grafana Dashboard Setup
- Troubleshooting a Blank Screen
- What’s Next?
Code Source
All code snippets shown in this post are available in the dedicated branch for this article on the project’s GitHub repository. Feel free to clone it and follow along:
https://github.com/franBec/tas/tree/feature/2025-11-02
Dependencies
We need to install the following packages:
prom-client: Library for generating metrics in the Prometheus format. By calling one simple function, we gain automatic insight into CPU, memory, garbage collection, data that is often complex to gather via pure OpenTelemetry methods.pino: Very low overhead JavaScript logger.pino-loki: Transport layer that takes the formatted logs and ships them directly to our running Loki instance.@vercel/otel: Vercel’s official OpenTelemetry distribution library for Next.js, making tracing and span creation simple within the framework.@opentelemetry/sdk-logs/@opentelemetry/api-logs/@opentelemetry/instrumentation: The foundational OpenTelemetry components needed to set up a proper tracing and logging ecosystem.
To install them run:
pnpm add prom-client pino pino-loki @vercel/otel @opentelemetry/sdk-logs @opentelemetry/api-logs @opentelemetry/instrumentation
The Node.js Runtime Environment
A critical consideration in Next.js is that parts of your application might run in different environments.
- Node.js Runtime: The traditional, full-featured server environment. This is where system-level monitoring tools like
prom-clientmust run. - Edge Runtime: A lightweight environment optimized for network speed. It does not support full Node.js APIs.
Along some code snippets you will find explicitly checks for the nodejs runtime environment to prevent runtime crashes when importing and initializing our monitoring tools.
Next.js Instrumentation
Next.js uses the special src/instrumentation.ts file to run initialization code once when a new server instance starts. This is the perfect place to register our metrics system.
We will:
- Initialize the metrics registry and make it globally available using
globalThis.metrics. - Initialize the logger and make it globally available using
globalThis.logger.- Enable Trace-to-Logs Correlation.
- Register OpenTelemetry.
declare global {
    var metrics:
        | {
        registry: any;
    }
        | undefined;
    var logger: any | undefined;
}

export async function register() {
    if (process.env.NEXT_RUNTIME === "nodejs") {
        const { Registry, collectDefaultMetrics } = await import("prom-client");
        const pino = (await import("pino")).default;
        const pinoLoki = (await import("pino-loki")).default;
        const { registerOTel } = await import("@vercel/otel");

        //prom-client initialization
        const prometheusRegistry = new Registry();
        collectDefaultMetrics({
            register: prometheusRegistry,
        });
        globalThis.metrics = {
            registry: prometheusRegistry,
        };

        //loki initialization
        globalThis.logger = pino(
            {
                mixin() {
                    const { trace } = require("@opentelemetry/api");
                    const span = trace.getActiveSpan();
                    if (span) {
                        const context = span.spanContext();
                        return {
                            trace_id: context.traceId,
                            span_id: context.spanId,
                            trace_flags: context.traceFlags,
                        };
                    }
                    return {};
                },
            },
            pinoLoki({
                host: process.env.LOKI_HOST || "http://localhost:3100",
                batching: true,
                interval: 5,
                labels: {
                    app: process.env.OTEL_SERVICE_NAME || "next-app",
                    environment: process.env.NODE_ENV || "development",
                },
            })
        );

        //OTel registration
        registerOTel();
    }
}
- Linting Exception: Due to the necessary
globalThisvariable declarations, this file will clash with the linting rules. Addsrc/instrumentation.tsto theeslint.config.mjsignores list. - Testing Exception: As an infrastructure file, this is not suitable for unit testing. Add
src/instrumentation.tsto thevitest.config.mtstest coverage exclude list.
Environment Variables Setup
For Loki and OTel to know where to send its data and how to label it, we need to set specific environment variables.
-
IDE Run/Debug Configuration: If you use an IDE like JetBrains WebStorm , you can add these variables directly to the Run/Debug configuration options:
Set the following environment string:
LOKI_HOST=http://localhost:3100;OTEL_EXPORTER_OTLP_ENDPOINT=http://localhost:4318;OTEL_LOG_LEVEL=info;OTEL_SERVICE_NAME=next-app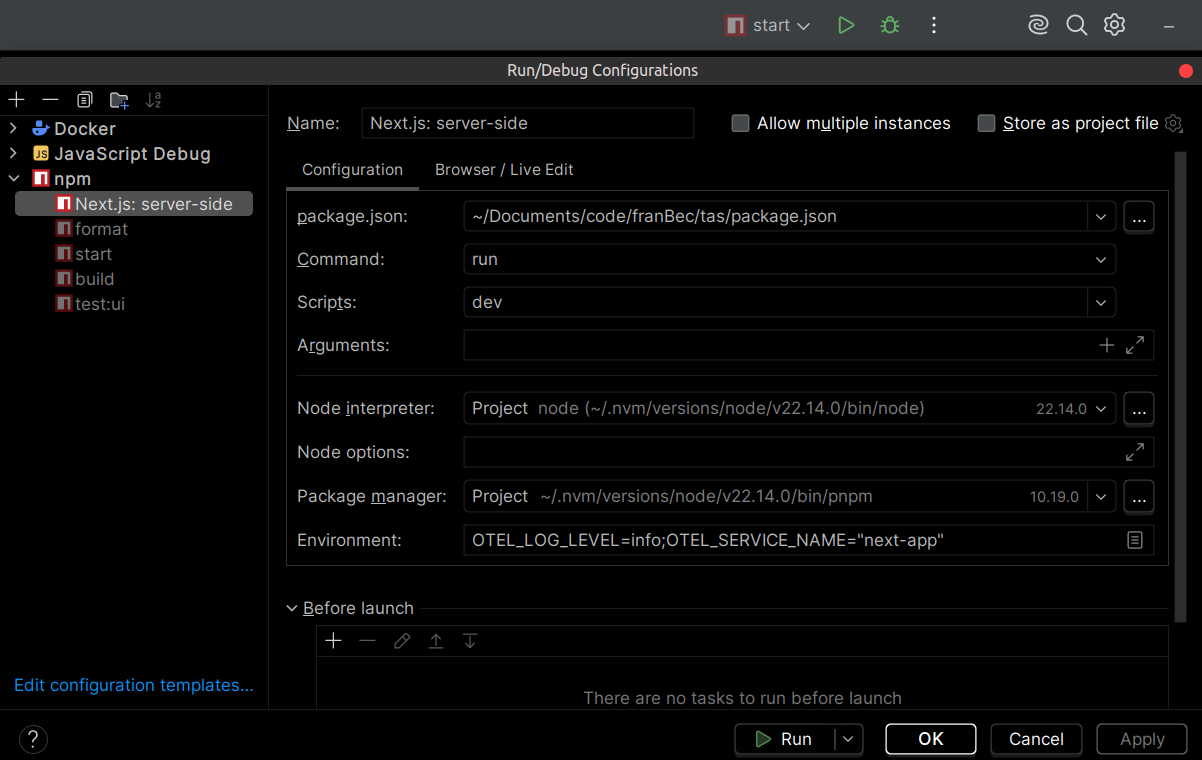
Tip: It is highly recommended to save all your non-sensitive development environment variables in a text file (e.g.,
src/resources/env-dev.txt) so new developers can easily copy-paste them into their IDE setup. -
Project
.envfile: We use the project.envfile to reference these environment variables, making them available to the Next.js build and runtime process.# OTel Configuration OTEL_LOG_LEVEL="${OTEL_LOG_LEVEL}" OTEL_SERVICE_NAME="${OTEL_SERVICE_NAME}" OTEL_EXPORTER_OTLP_ENDPOINT="${OTEL_EXPORTER_OTLP_ENDPOINT}" # Loki Configuration LOKI_HOST="${LOKI_HOST}"
/api/metrics
Prometheus is a pull-based system: it doesn’t wait for your application to send data; it periodically scrapes (pulls) data from a dedicated HTTP endpoint you expose.
We create a simple api/metrics API route that uses our globally defined registry to output the metrics data.
import { NextResponse } from "next/server";

export const runtime = "nodejs";

export async function GET() {
  try {
    if (!globalThis?.metrics?.registry) {
      return new NextResponse("Metrics Unavailable", {
        status: 503,
        headers: {
          "Content-Type": "text/plain",
        },
      });
    }

    const metrics = await globalThis.metrics.registry.metrics();
    return new NextResponse(metrics, {
      headers: {
        "Content-Type": "text/plain",
      },
    });
  } catch (error) {
    console.error("Error collecting metrics:", error);
    return new NextResponse("Error collecting metrics", {
      status: 500,
      headers: {
        "Content-Type": "text/plain",
      },
    });
  }
}
Logger Demonstration
Now that the logger is initialized globally, let’s create two simple API routes to demonstrate successful logging and error logging. We ensure these routes explicitly use the nodejs runtime to guarantee access to the instrumentation setup.
We’ll define /api/hello-world (always 200) and /api/something-is-wrong (always 500).
/api/hello-world
export const runtime = "nodejs";

export async function GET() {
    try {
        const { randomUUID } = await import("crypto");

        globalThis?.logger?.info({
            meta: {
                requestId: randomUUID(),
                extra: "This is some extra information that you can add to the meta",
                anything: "anything",
            },
            message: "Successful request handled",
        });
        return Response.json({
            message: "Hello world",
        });
    } catch (error) {
        globalThis?.logger?.error({
            err: error,
            message: "Something went wrong during success logging",
        });
    }
}
/api/something-is-wrong
export const runtime = "nodejs";

export async function GET() {
    try {
        throw new Error("Something is fundamentally wrong with this API endpoint");
    } catch (error) {
        globalThis?.logger?.error({
            err: error,
            message: "An error message here",
        });
        return new Response(JSON.stringify({ error: "Internal Server Error" }), {
            status: 500,
        });
    }
}
Monitoring Stack Setups
We are going to define two docker-compose.yml files:
- src/resources/monitoring.yml (Production – Coolify): Defines the services and configuration with environment variables suited for deployed via Coolify.
- src/resources/monitoring-dev.yml (Local Development): Ports exposed for debugging.
Each monitoring*.yml file is too long to analyze here in detail (+200 lines), but in essence they describe how Docker should create and connect the full monitoring environment.
| Aspect | Development | Production |
|---|---|---|
| Network | monitoring (bridge) |
coolify (external) |
| Next.js Location | Runs on host machine | Runs inside Docker |
| Next.js Target | host.docker.internal:3000 |
next-app:3000 |
| Loki Host (from Next.js) | http://localhost:3100 |
http://loki:3100 |
| OTEL Endpoint | http://localhost:4317 |
http://otel-collector:4317 |
| Tempo User | root (permission shortcut) |
Default user (secure) |
| Ports Exposed | All (debugging) | Minimal (security) |
Grafana Dashboard Setup
Make sure your Docker engine (like Docker Desktop ) is running in the background.
- Start the Stack:
docker compose -f src/resources/monitoring-dev.yml up - Start the App: Run your Next.js application’s start script on the host machine.
Go to http://localhost:3001
and log in using the credentials defined in the monitoring-dev.yml (admin_user/admin_password).
Import a Dashboard
- Go to Import dashboard
. Upload a dashboard JSON file I’ve already prepared
.
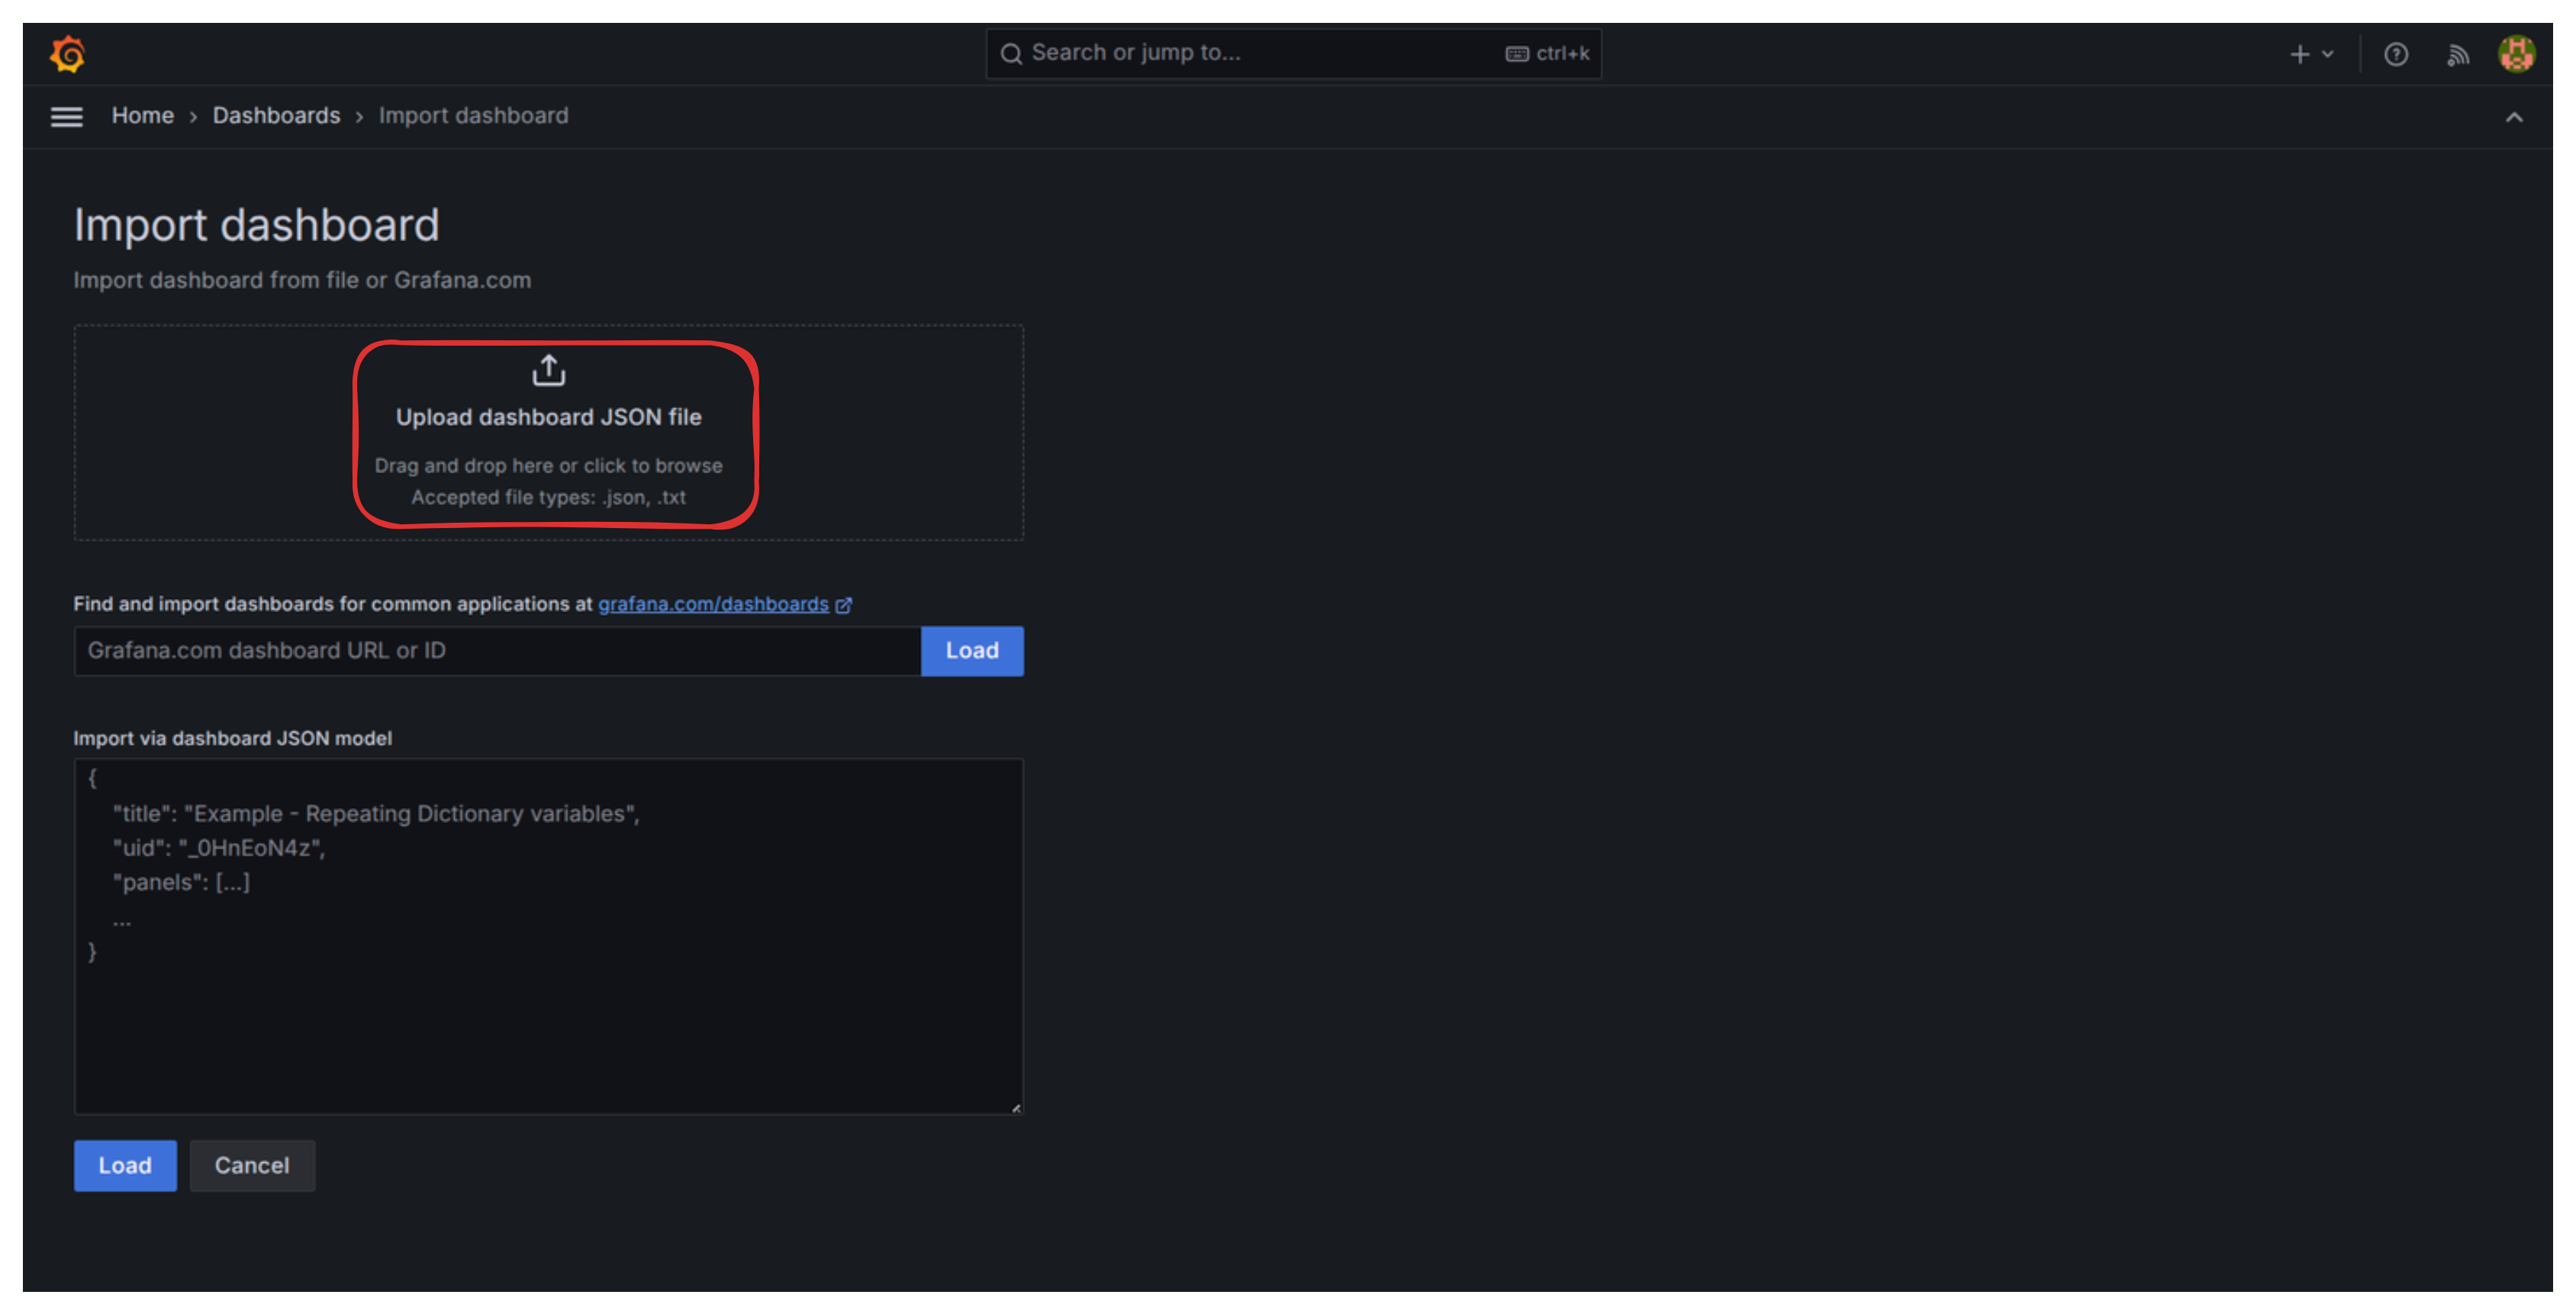
- When asked for a Loki and Prometheus datasource, simply select them and then click on “Import”.

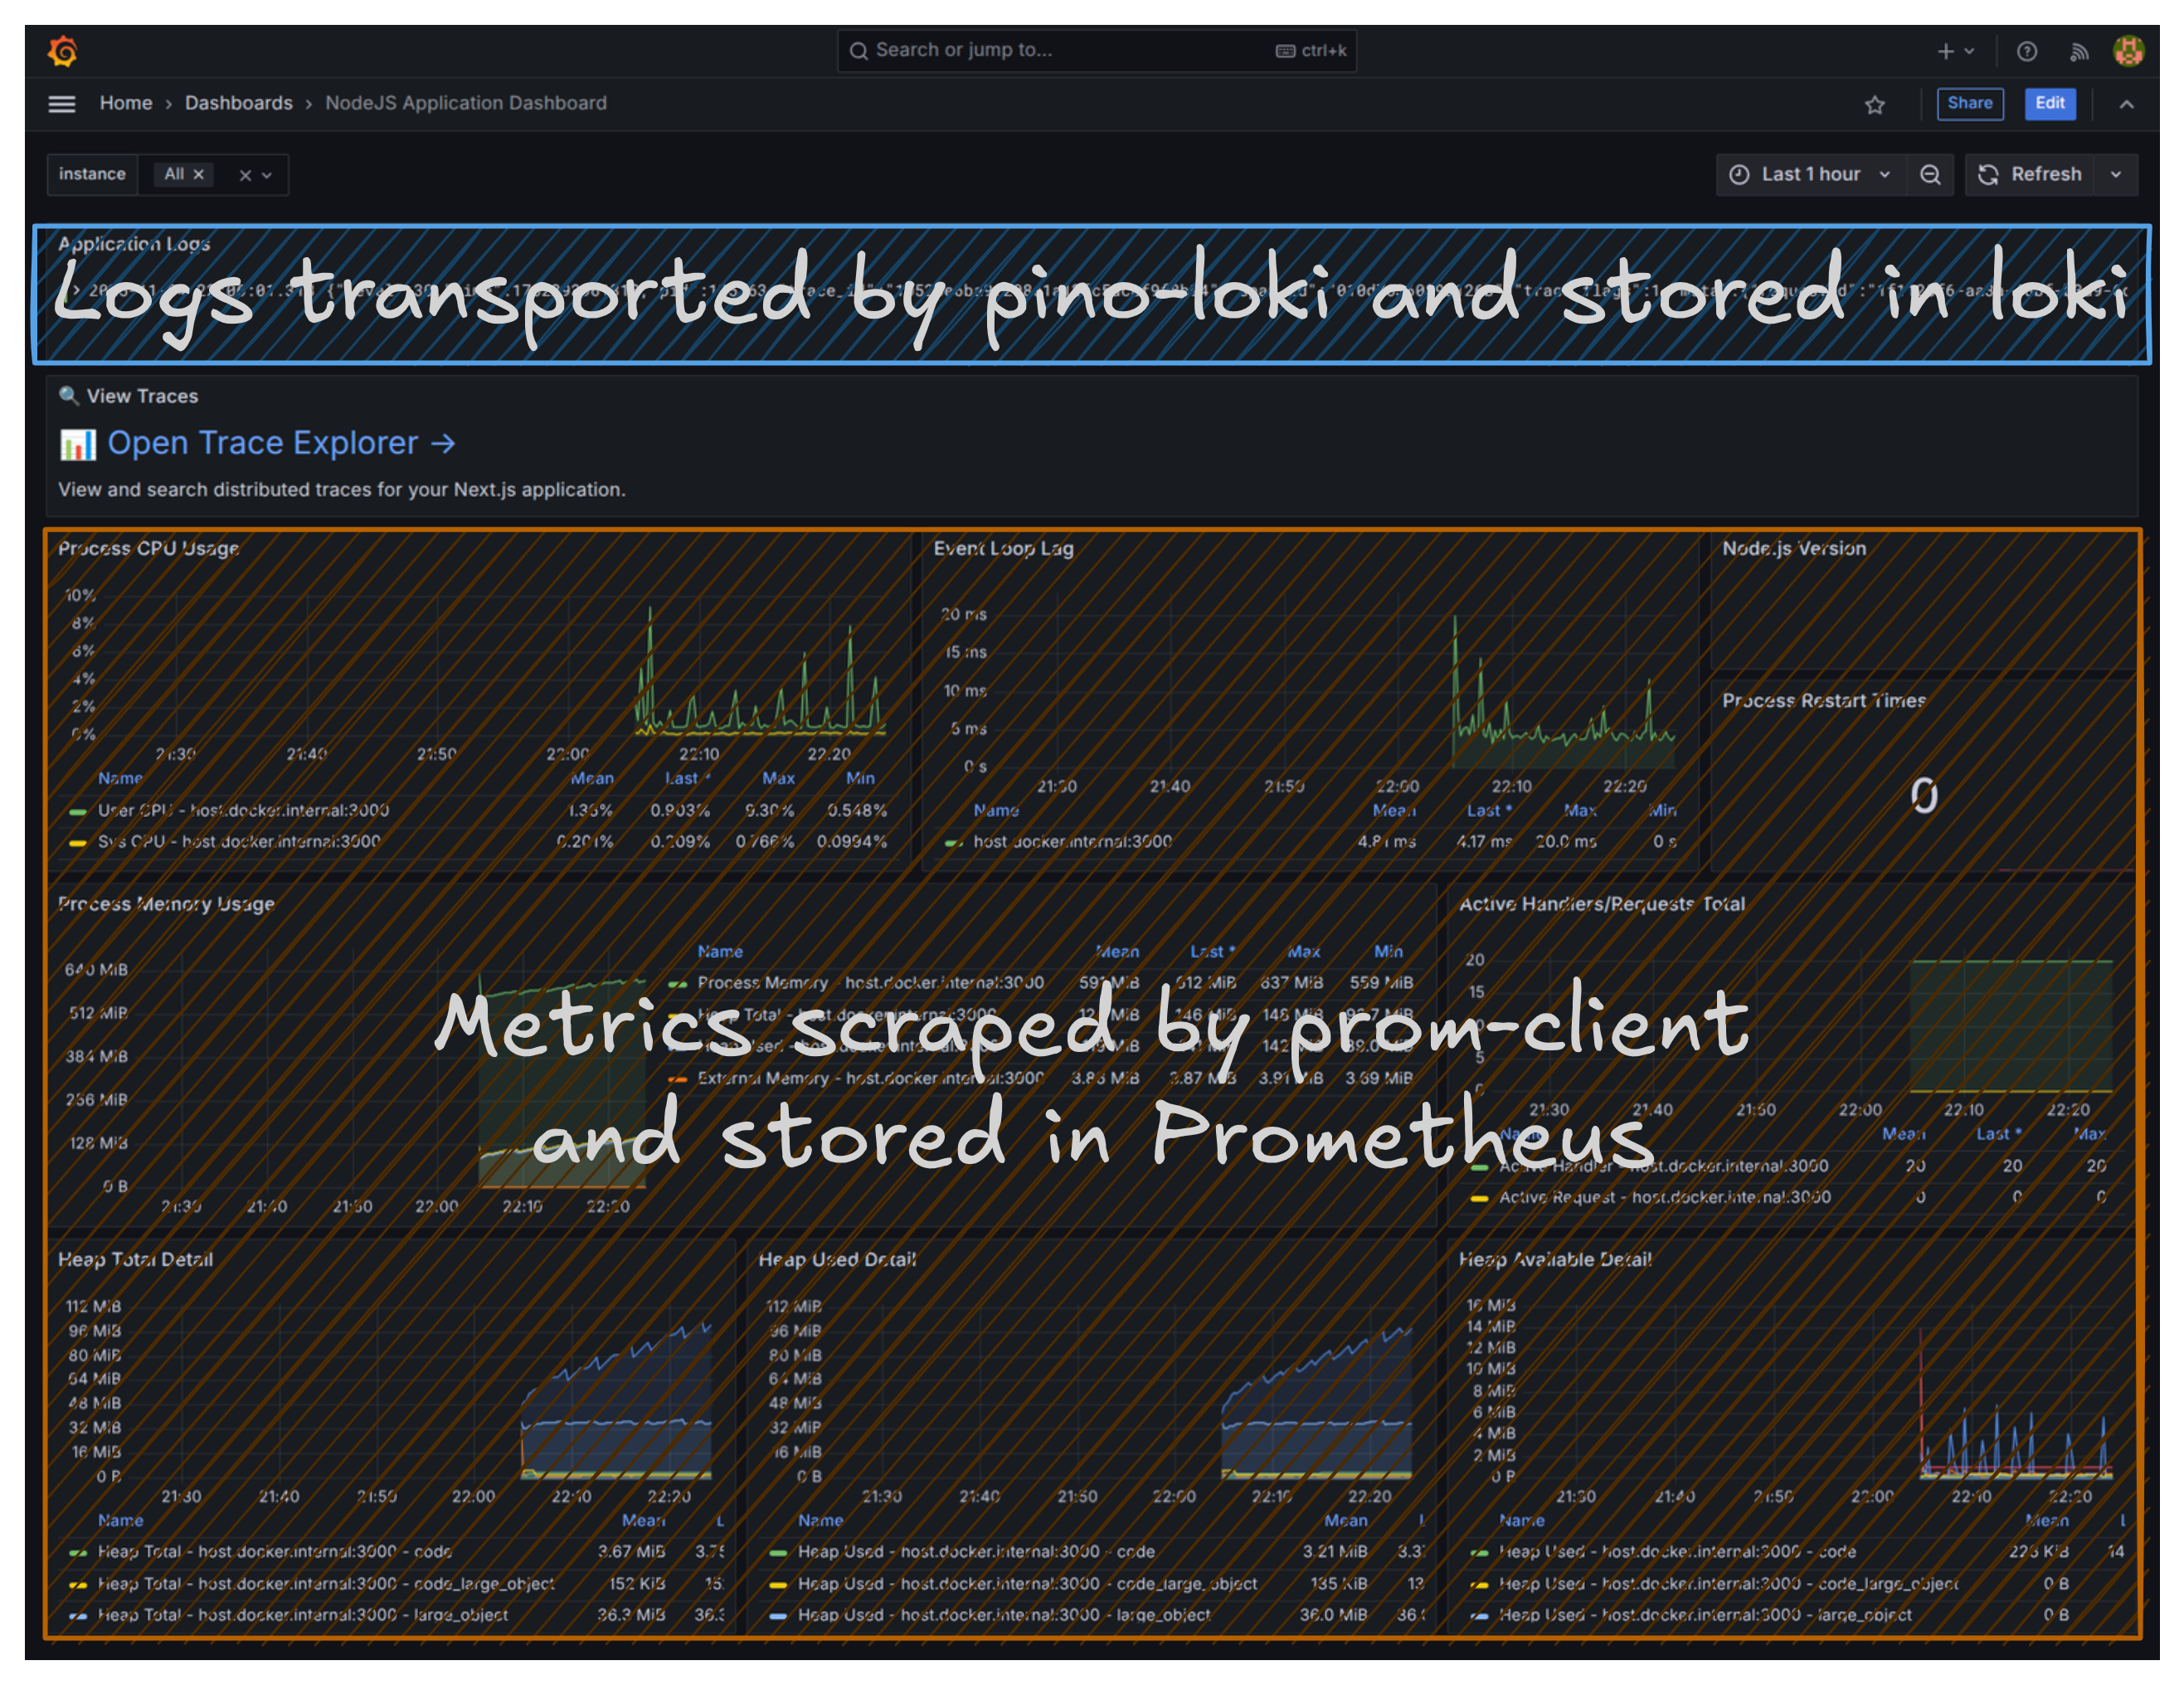
You now have a unified monitoring dashboard displaying both metrics (like CPU usage, memory consumption, garbage collection activity, request counts), application logs, and a link to the Trace Explorer.
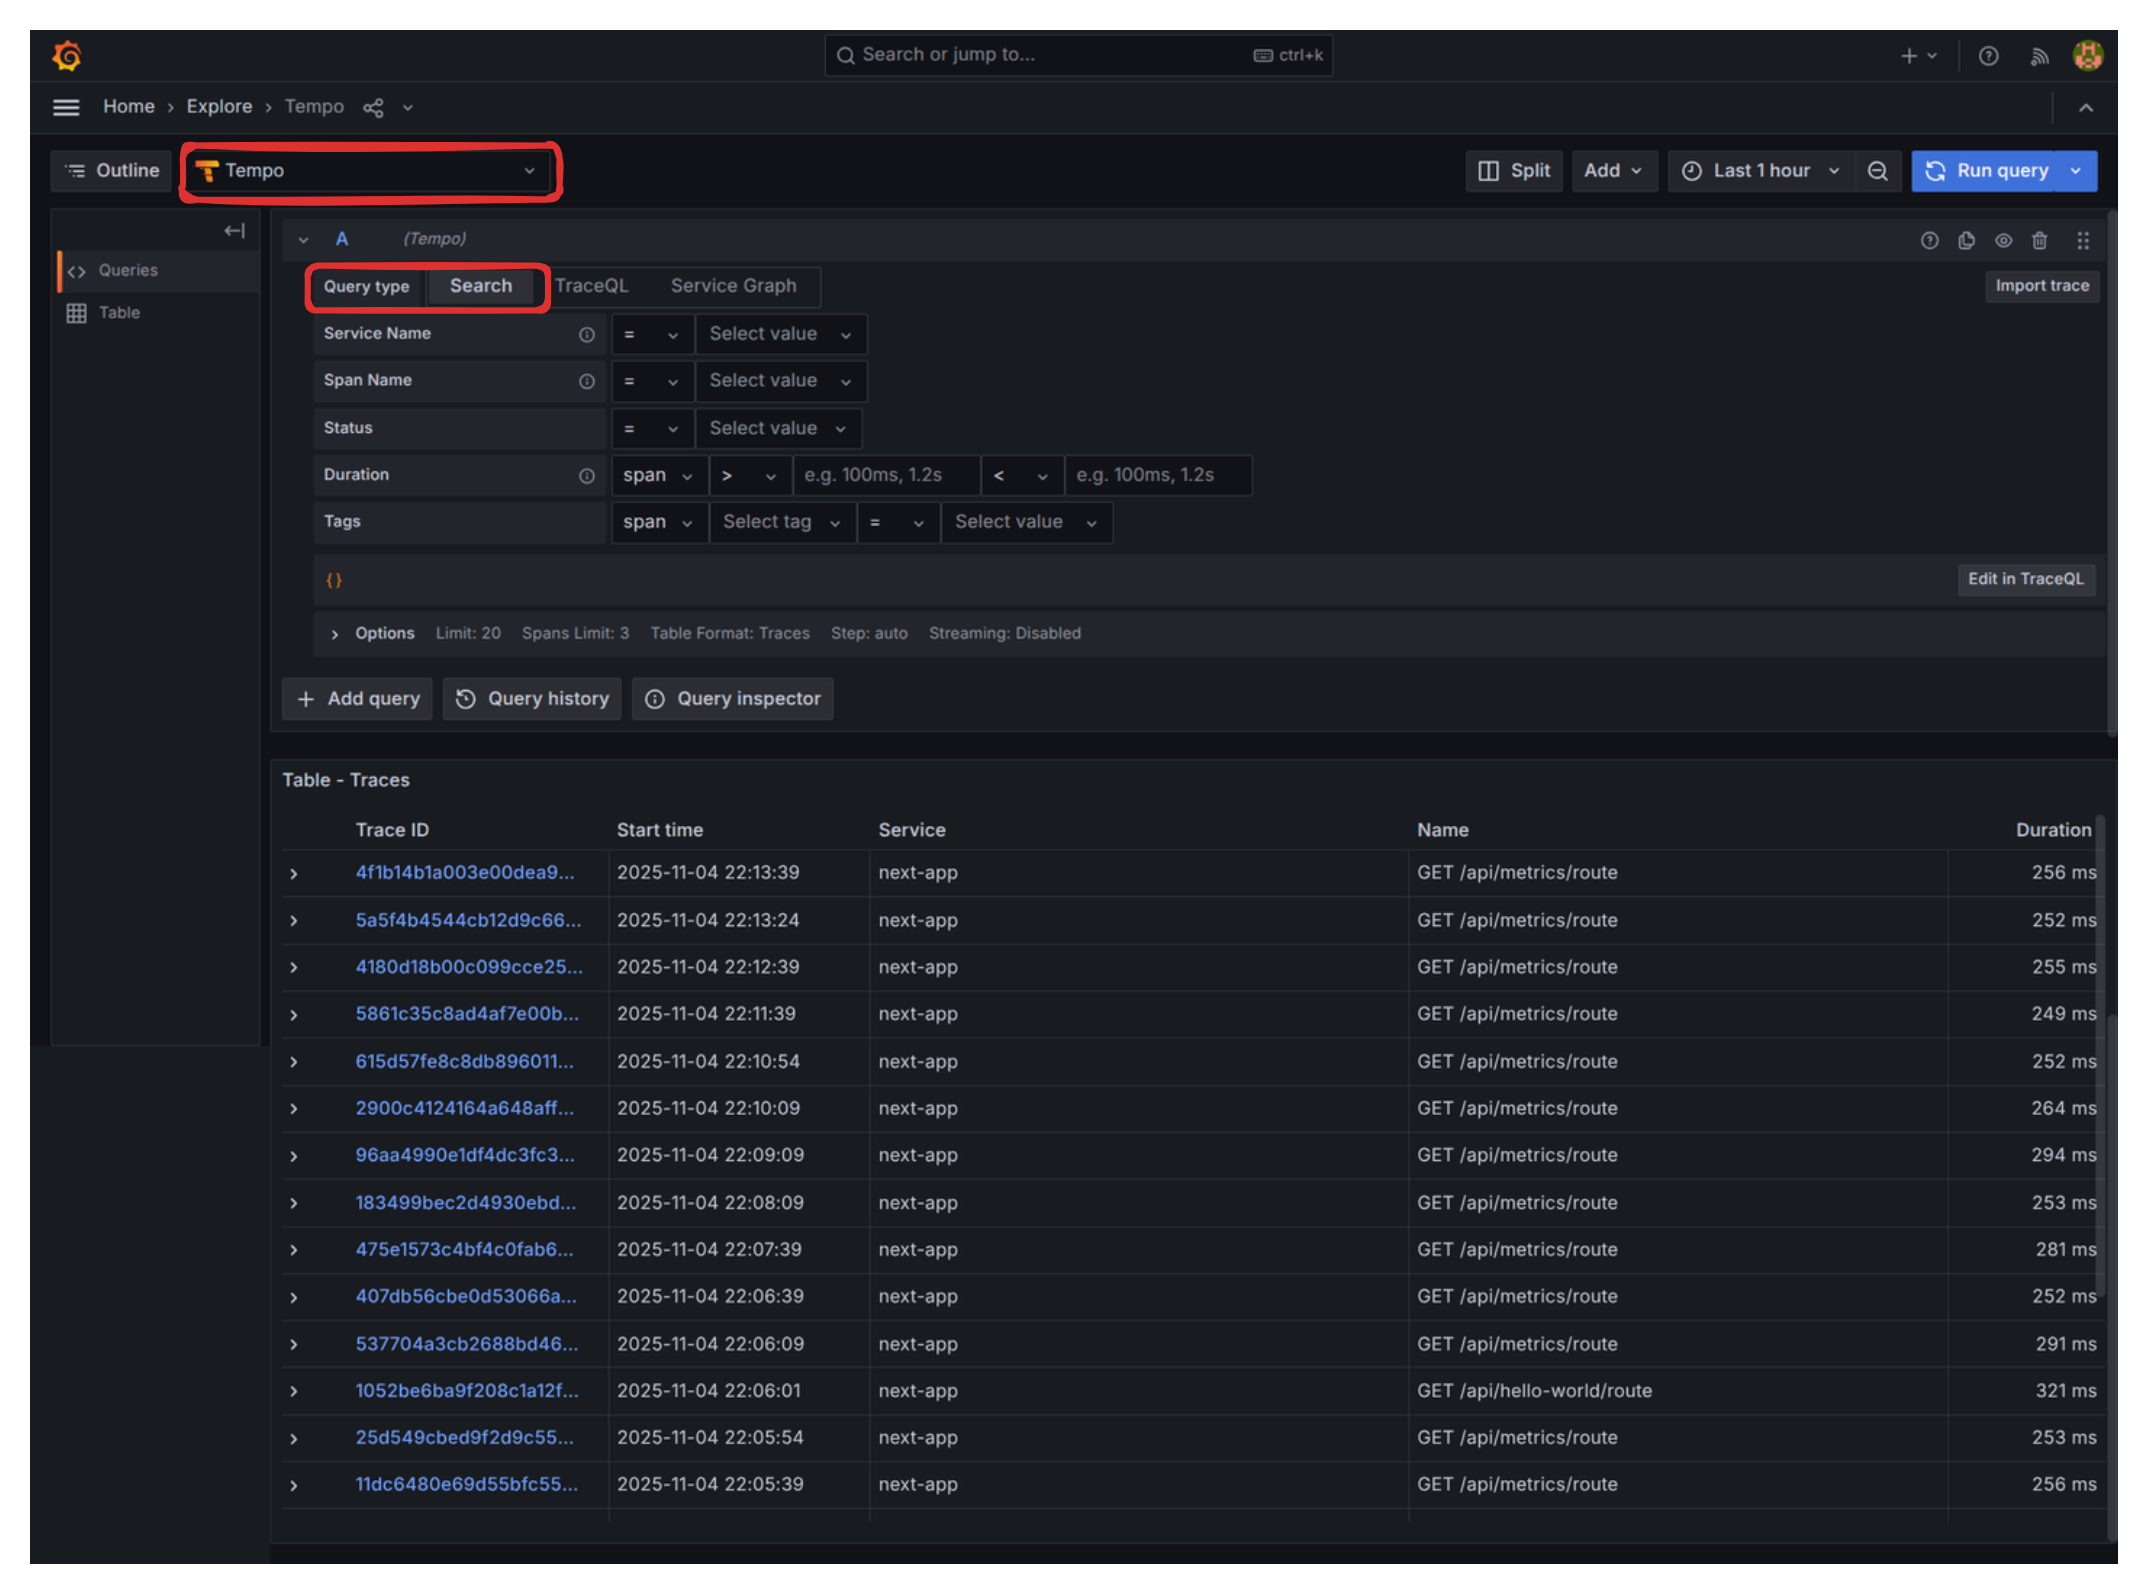
- Hit the
/api/hello-worldand/api/something-is-wrongroutes a few times to generate data. - When checking “Trace Explorer”, make sure to have “Tempo” as the selected datasource and “Search” as Query type.
Troubleshooting Grafana Panel: Fixing the Node.js Version
One issue with this dashboard is that the “Node.js version” panel appears empty. Let’s fix this minor inconvenience:
- Click on the three vertical dots in the top right corner of that empty panel and select Edit.

- In the Query editor (“Metric browser” area), clear the default query and input the correct metric name:
nodejs_version_info. - In the right-hand panel, under “Value options” -> “Calculation” set it to
Last *. - Under “Value options” -> “Fields” you should now be able to select the version string.
- Click “Run queries” to confirm the data appears.
- Click the “Save Dashboard” button (top right).
Troubleshooting a Blank Screen
Let’s return to the problem we had in Large Software Projects: Introduction to Monitoring : the blank production screen. We’ll recreate the scenario with a component that intentionally breaks.
Create a simple route /route-with-error with broken logic:
export const dynamic = "force-dynamic";

async function getData() {
    const res = await fetch("https://httpbin.org/status/500");
    return res.json();
}

export default async function RouteWithError() {
    const data = await getData();

    return (
        <div className="flex flex-col gap-4">
            <p>
                The data is: <strong>{JSON.stringify(data)}</strong>
            </p>
        </div>
    );
}
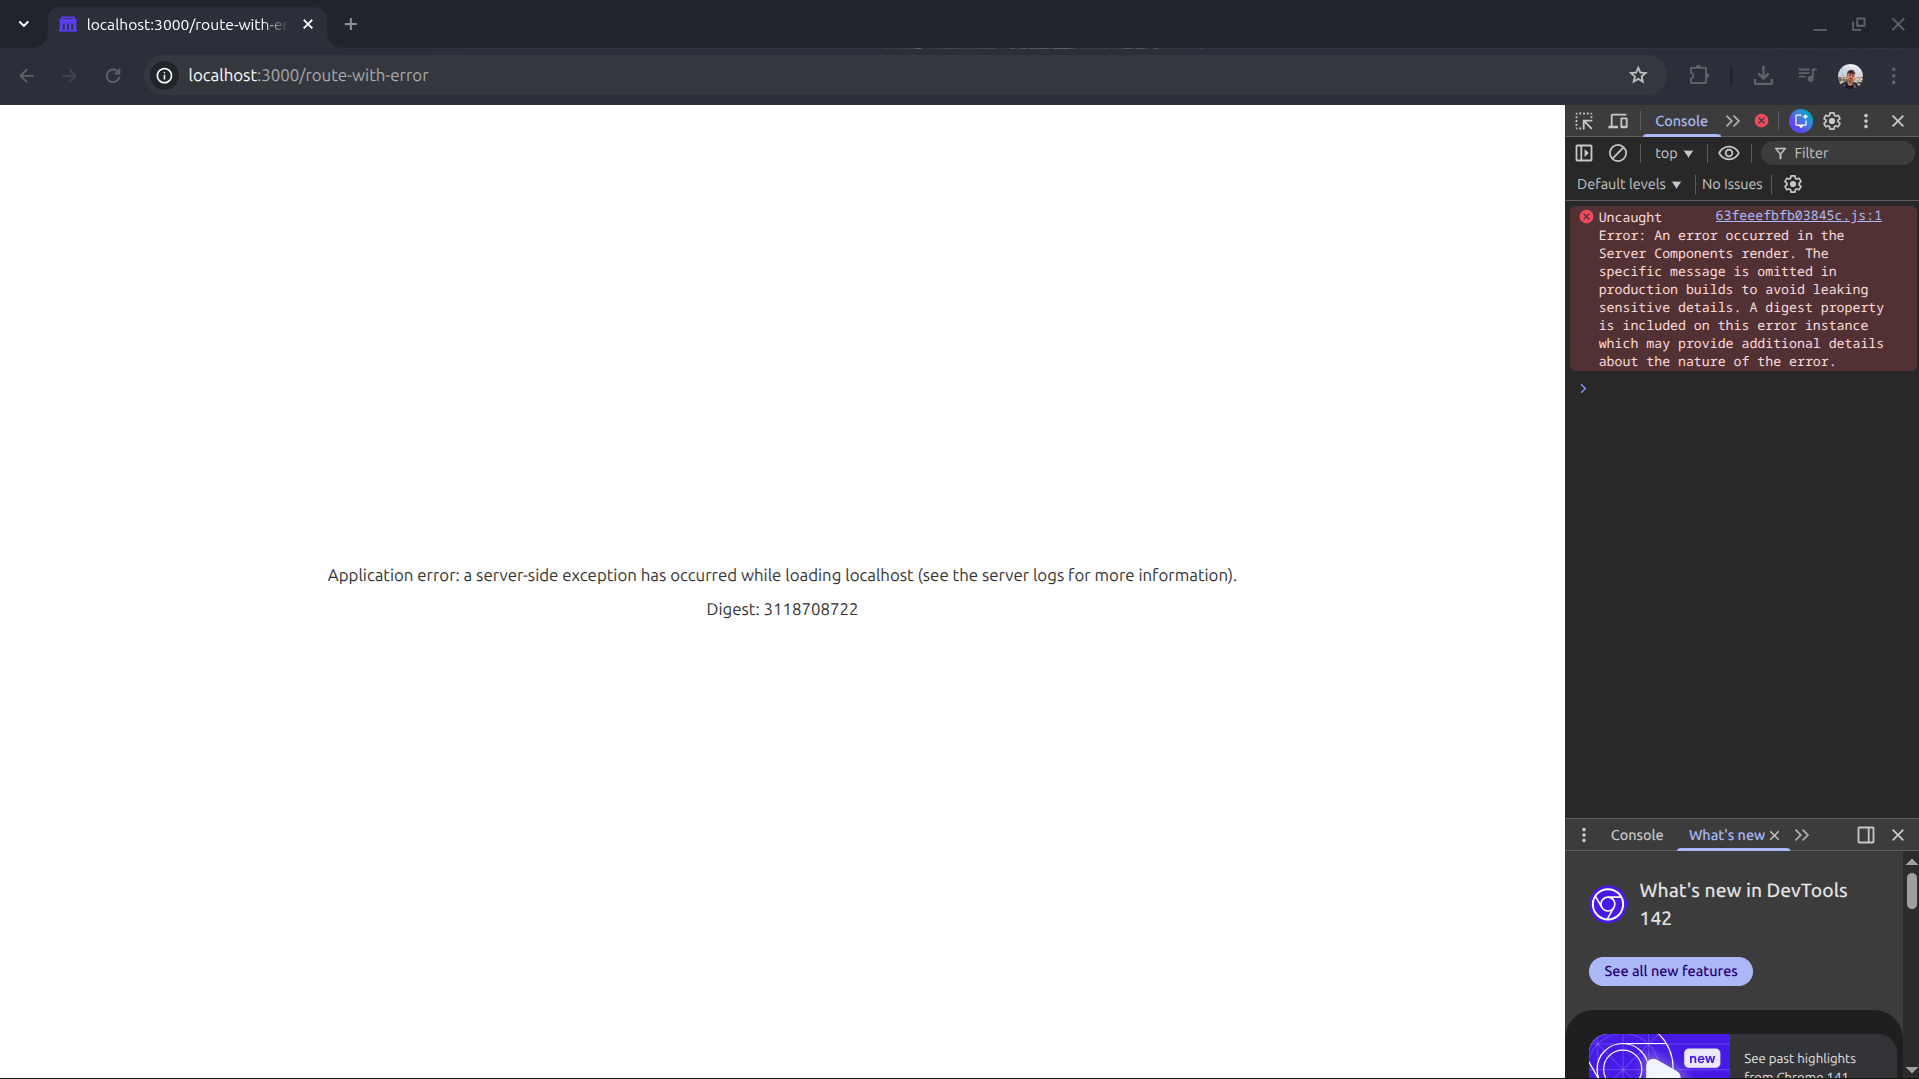
If you visit http://localhost:3000/route-with-error in a production build, you will get the dreaded blank page with no indication of what happened.
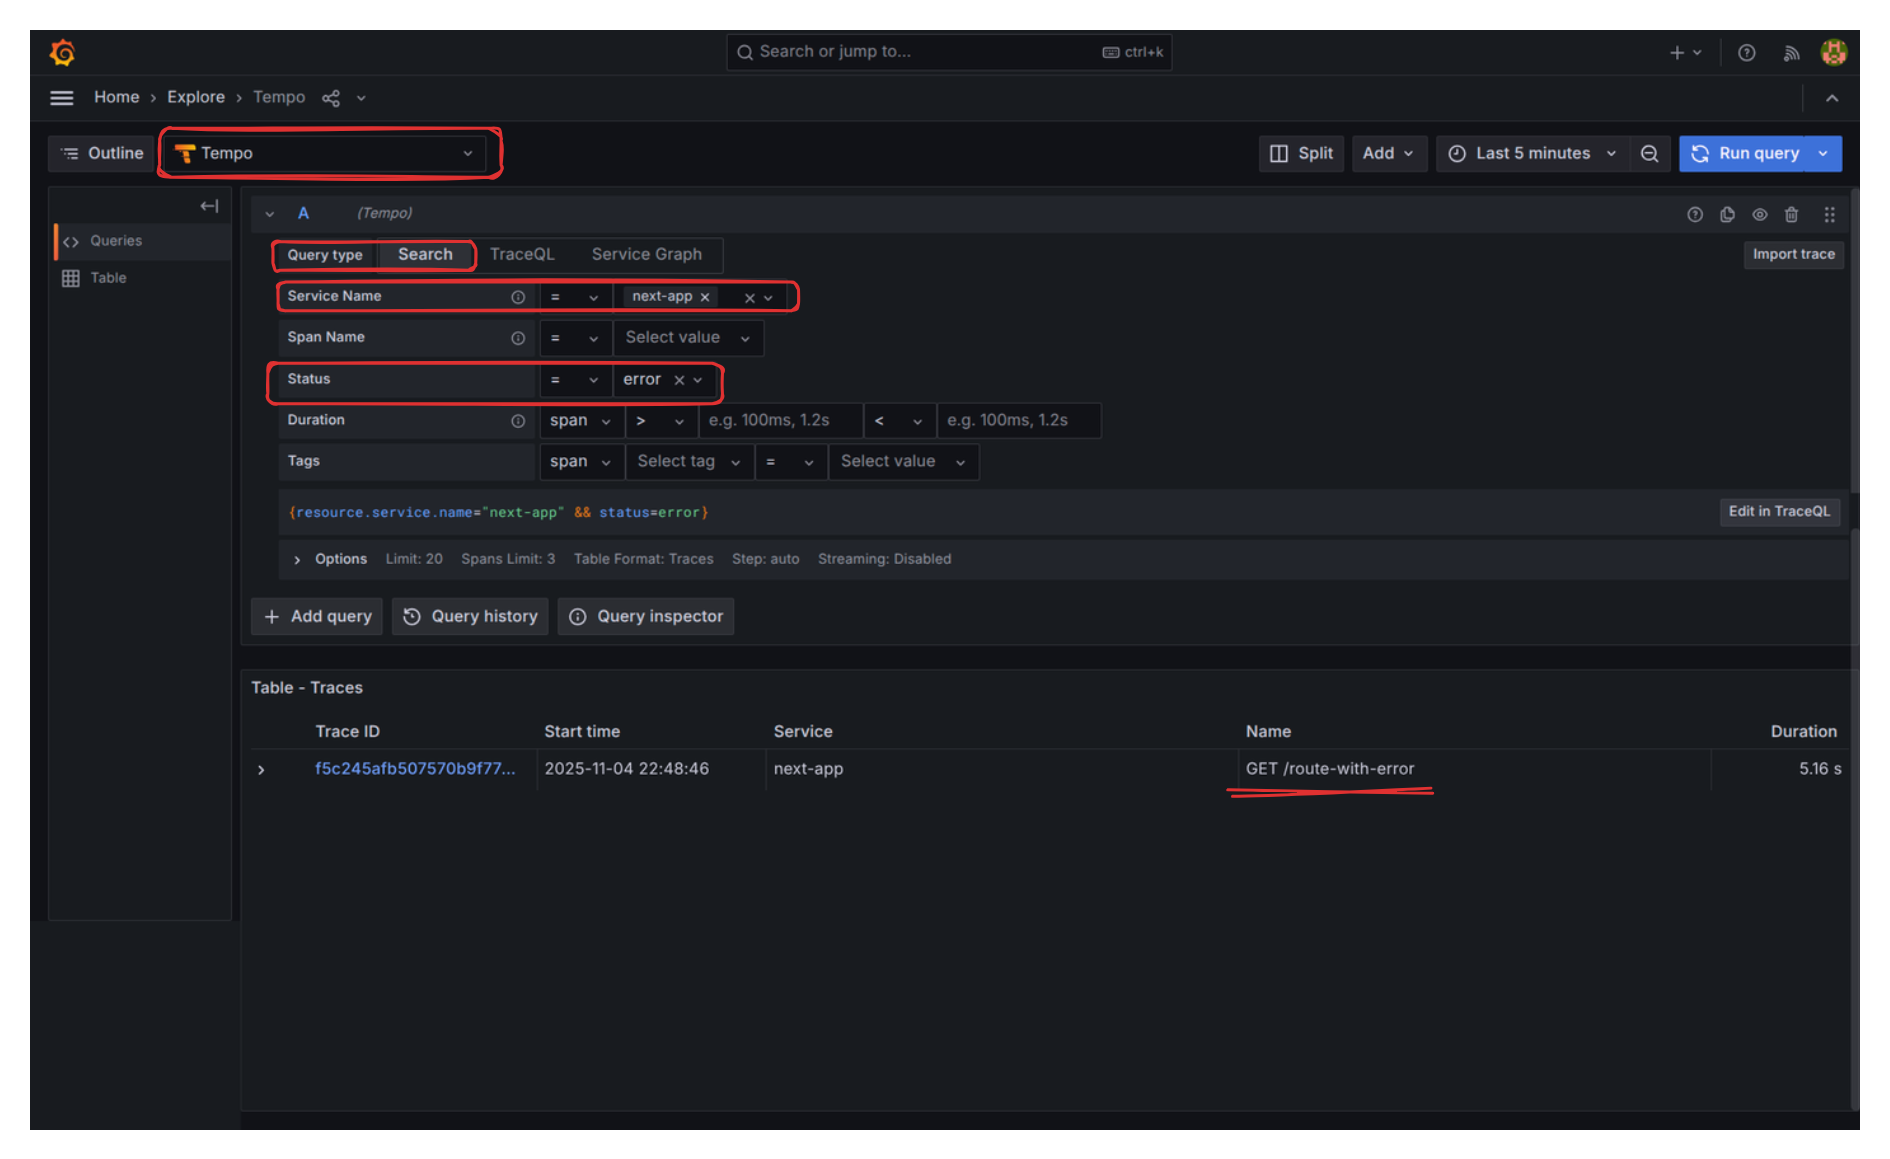
However, when checking “Trace Explorer” and filtering by Status “Error”, the story is completely different:
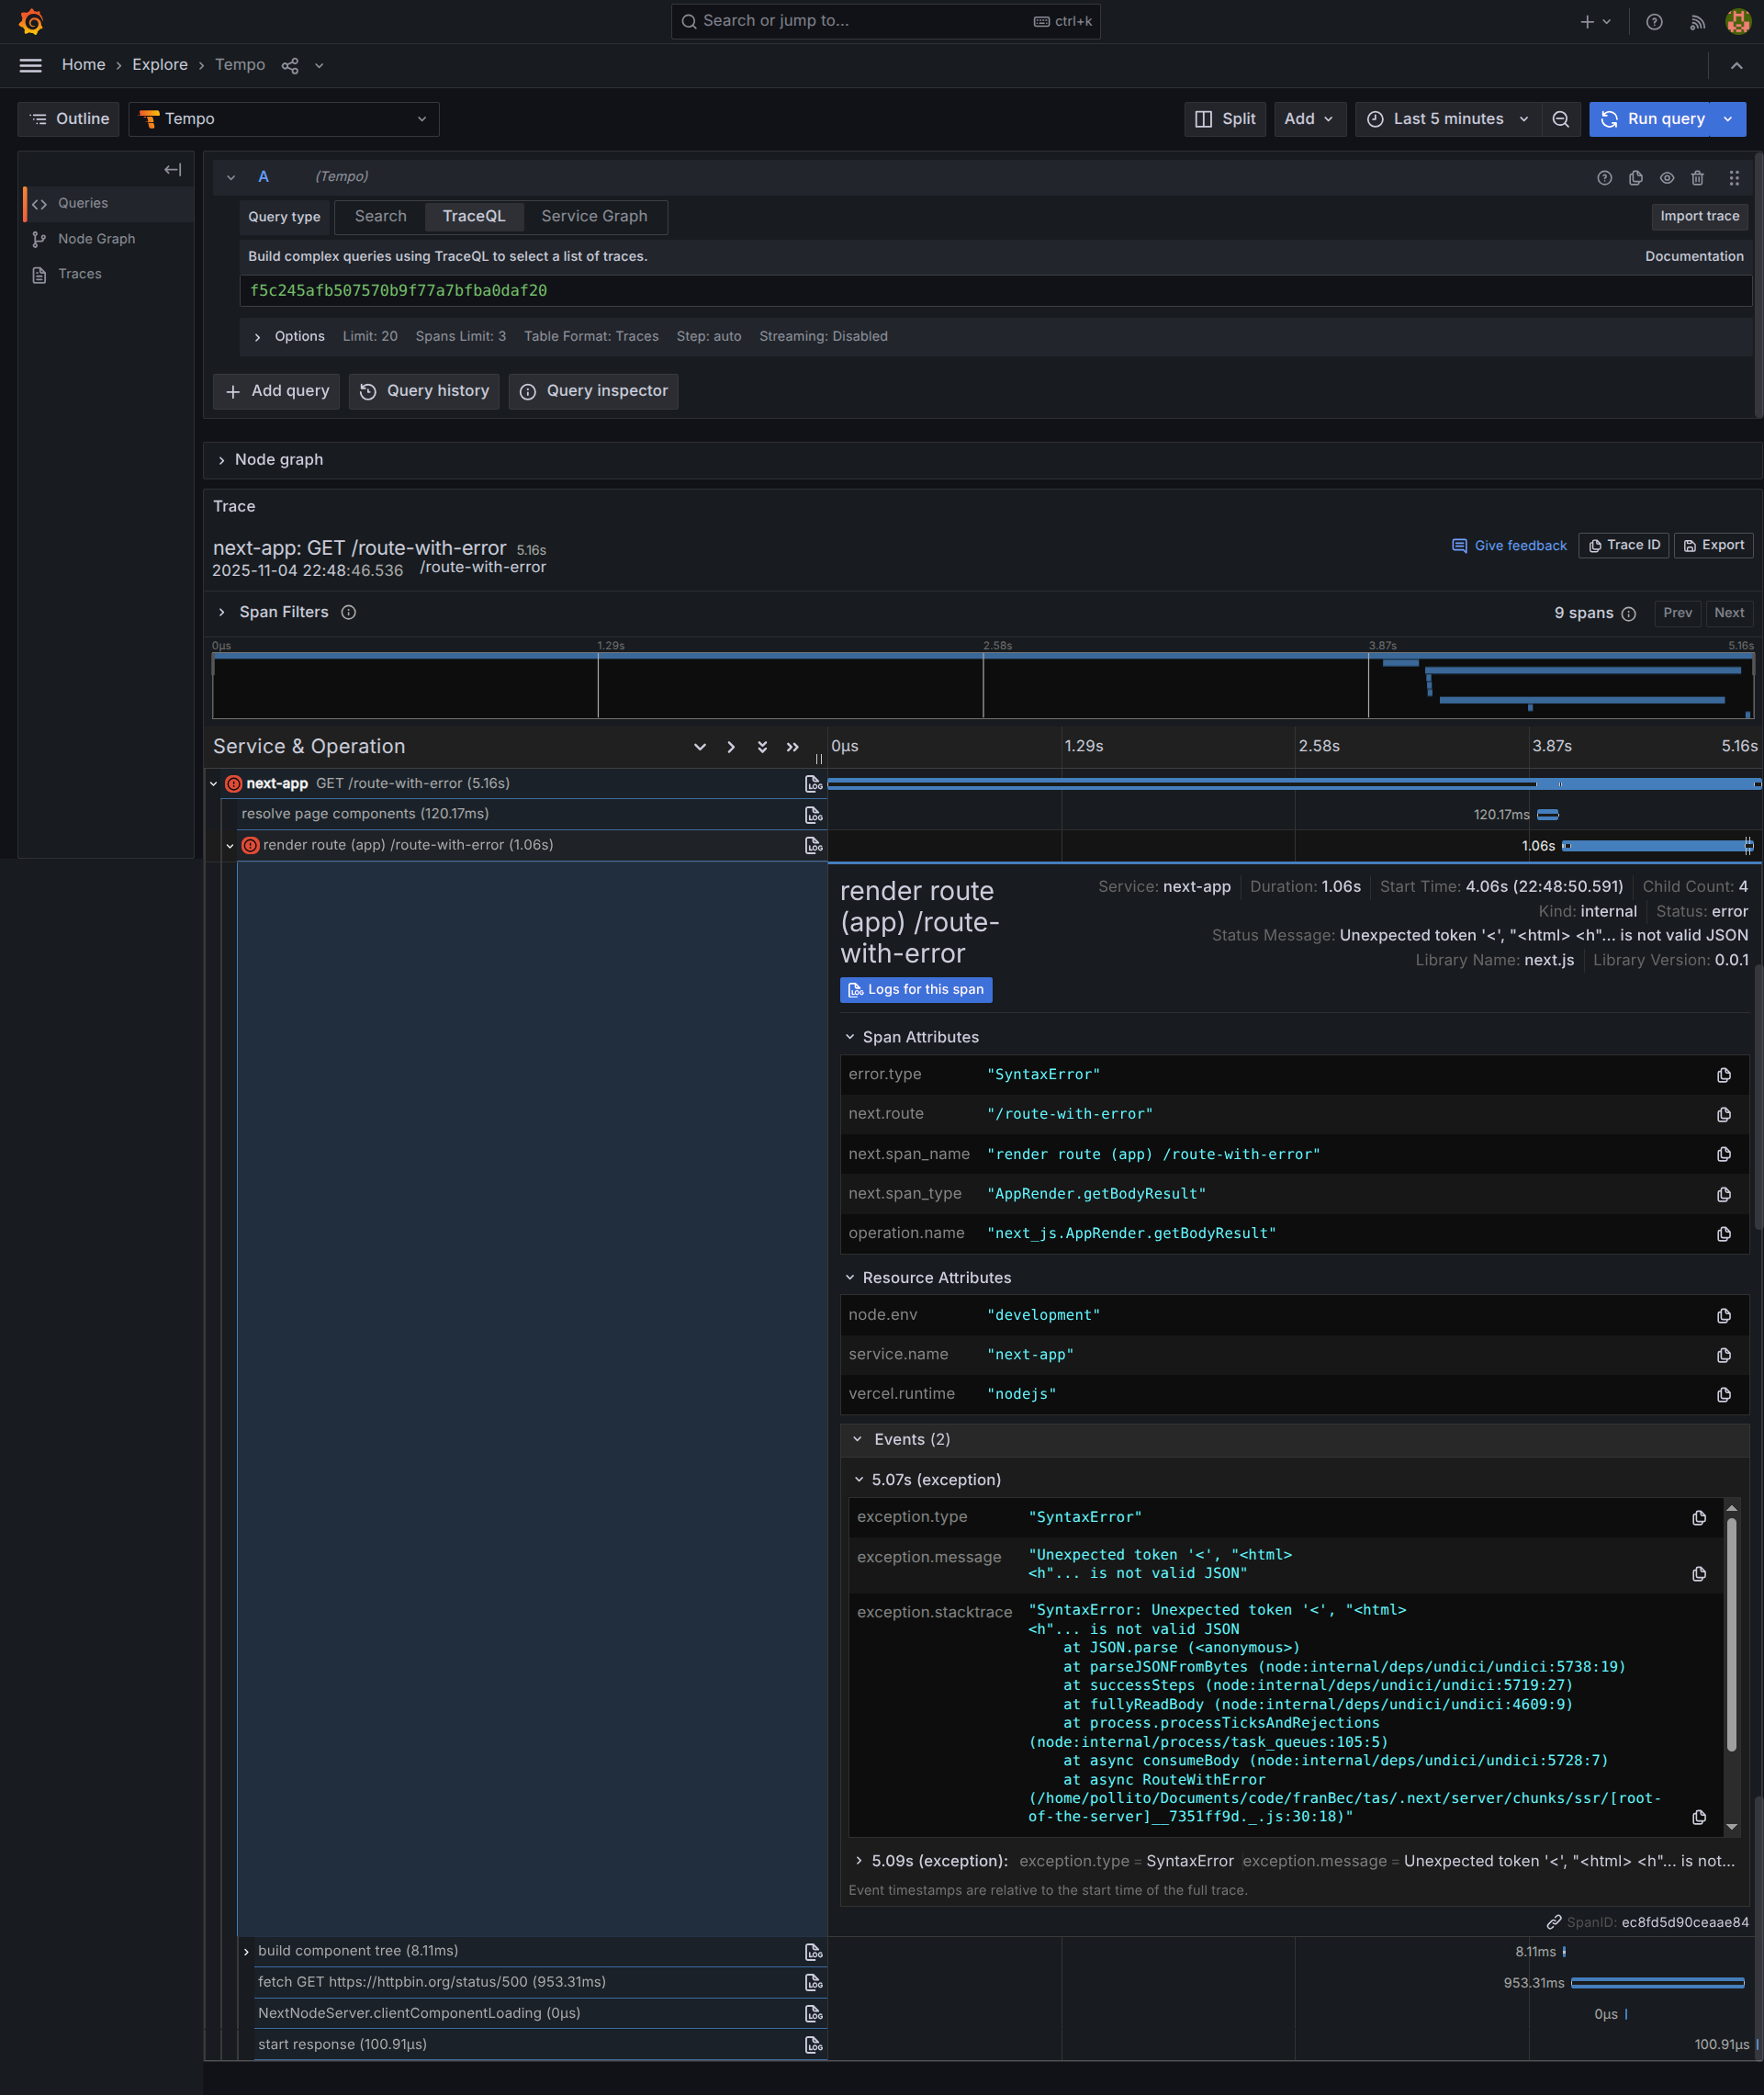
If we click into the trace, we find the exact details:
What’s Next?
We have established a robust, local monitoring stack using industry-standard tools. The obvious next step is deploying this same monitoring strategy to our production VPS environment, tackling the challenges of external hostnames, persistent storage, and authentication.
Next Blog: Large Software Projects: Monitoring your App in Production