
Large Software Projects: Monitoring your App in Production
Posted on November 3, 2025 • 5 minutes • 947 words • Other languages: Español
This post is part of my Large Software Projects blog series .
- Code Source
- Prerequisites: Transitioning to Production
- Step 1: Prepare Your Next.js App for Production
- (Optional) Add Health Check Endpoint
- Step 2: Create Monitoring Stack in Coolify
- Step 3: Connect Next.js App to Monitoring Stack
- Step 4: Verification and Visualization
- Step 5: Set Up Grafana Access
- What’s Next?
Code Source
All code snippets shown in this post are available in the dedicated branch for this article on the project’s GitHub repository. Feel free to clone it and follow along:
https://github.com/franBec/tas/tree/feature/2025-11-03
Prerequisites: Transitioning to Production
In the previous post , we successfully built a powerful local monitoring stack using Docker Compose.
The goal now is to lift this entire system—Metrics, Logs, and Traces—and deploy it alongside our Next.js application on our production VPS managed by Coolify.
Step 1: Prepare Your Next.js App for Production
(Optional) Add Health Check Endpoint
A simple health check endpoint is crucial for verifying that all our monitoring systems are correctly initialized and that our environment variables are being read properly.
Note on Security: While exposing this endpoint is helpful for debugging, it is generally recommended to restrict access to diagnostic endpoints in production and avoid exposing sensitive configuration data like environment variables here.
export const runtime = "nodejs";

export async function GET() {
    return Response.json({
        status: "OK",
        timestamp: new Date().toISOString(),
        monitoring: {
            metricsRegistry: !!globalThis?.metrics?.registry,
            logger: !!globalThis?.logger,
        },
        env: {
            otelLogLevel: process.env.OTEL_LOG_LEVEL,
            otelServiceName: process.env.OTEL_SERVICE_NAME,
            otelExporterOtlpEndpoint: process.env.OTEL_EXPORTER_OTLP_ENDPOINT,
            lokiHost: process.env.LOKI_HOST,
            nodeEnv: process.env.NODE_ENV,
        },
    });
}
Deploy Your Updated Next.js App
Commit and push these changes. If using Coolify’s standard CI/CD setup, the application will automatically deploy, but the monitoring will be broken until we deploy the stack in the next step.
Step 2: Create Monitoring Stack in Coolify
Create Docker Compose Service
- Go to your Coolify Project
- Click + Add Resource
- Select Docker Compose
- Let’s name it
monitoring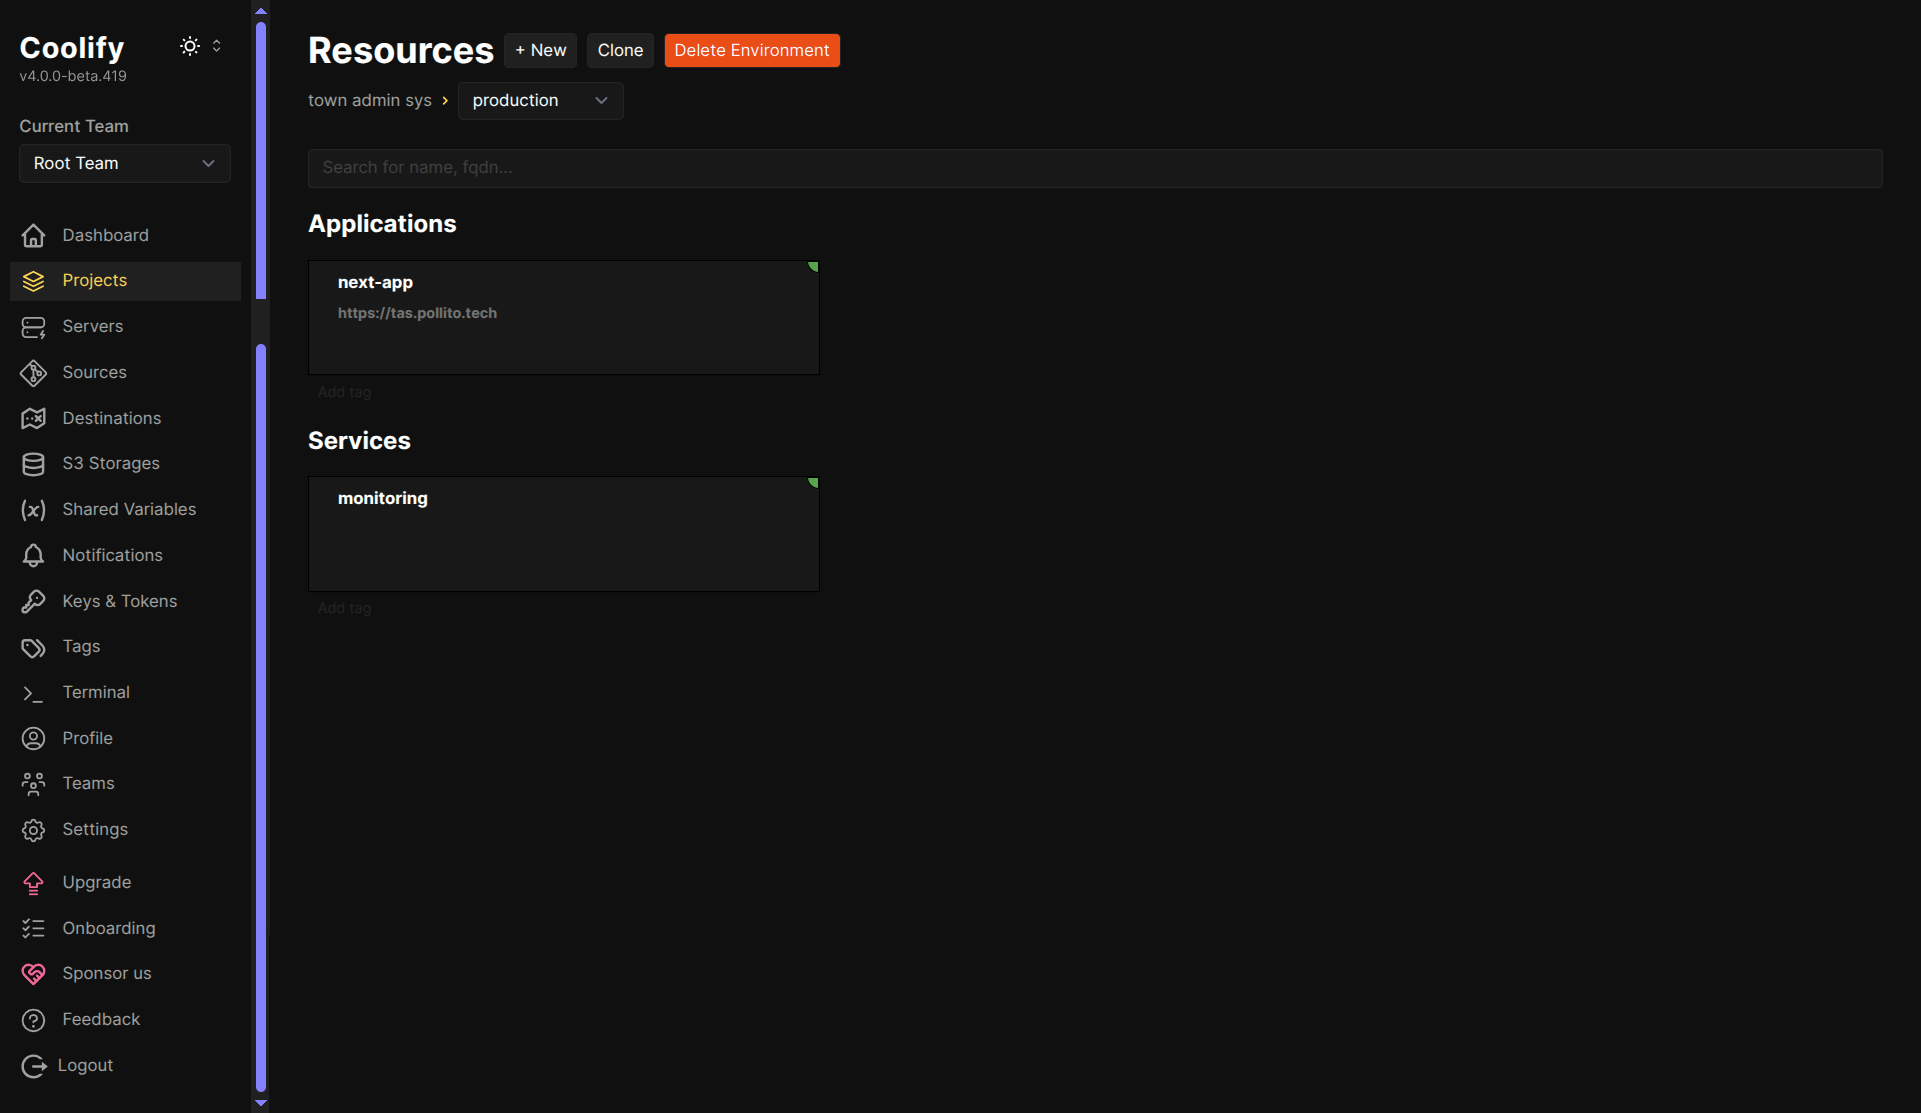
- In the monitoring service, click “Edit Compose File” and paste this complete configuration .
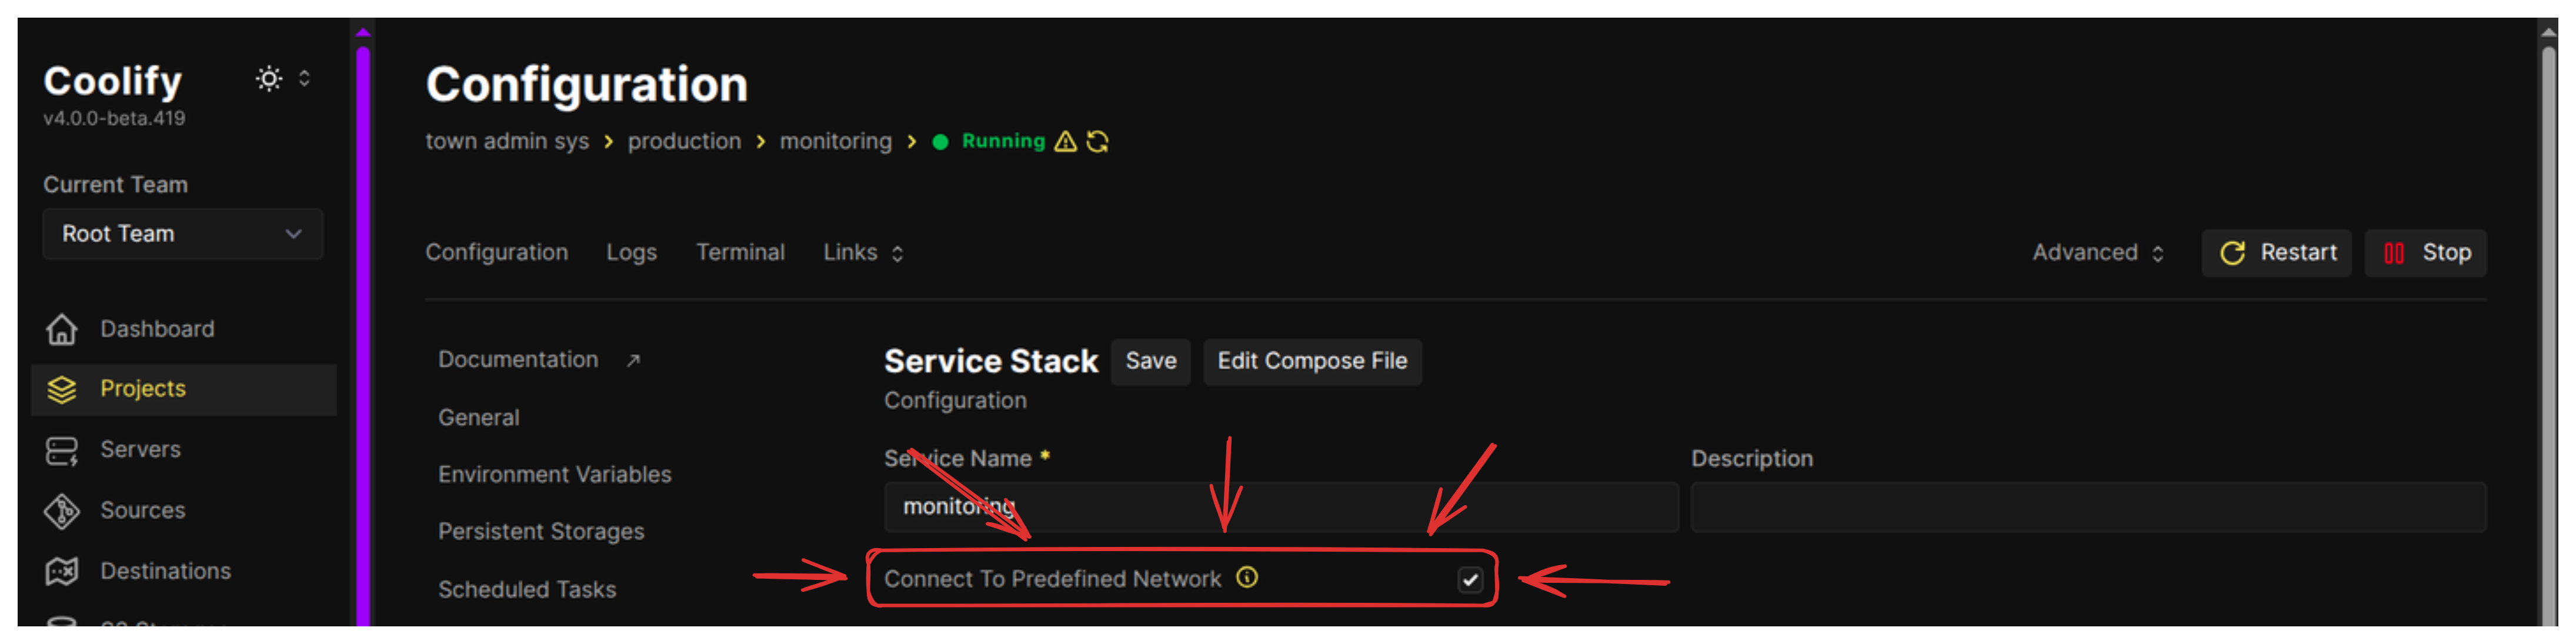
Connect Monitoring Stack to Coolify Network
All services must live on the same Docker network for DNS resolution to work.
Ensure the checkbox “Connect To Predefined Network” is checked. Coolify will connect the stack to its default network named coolify.
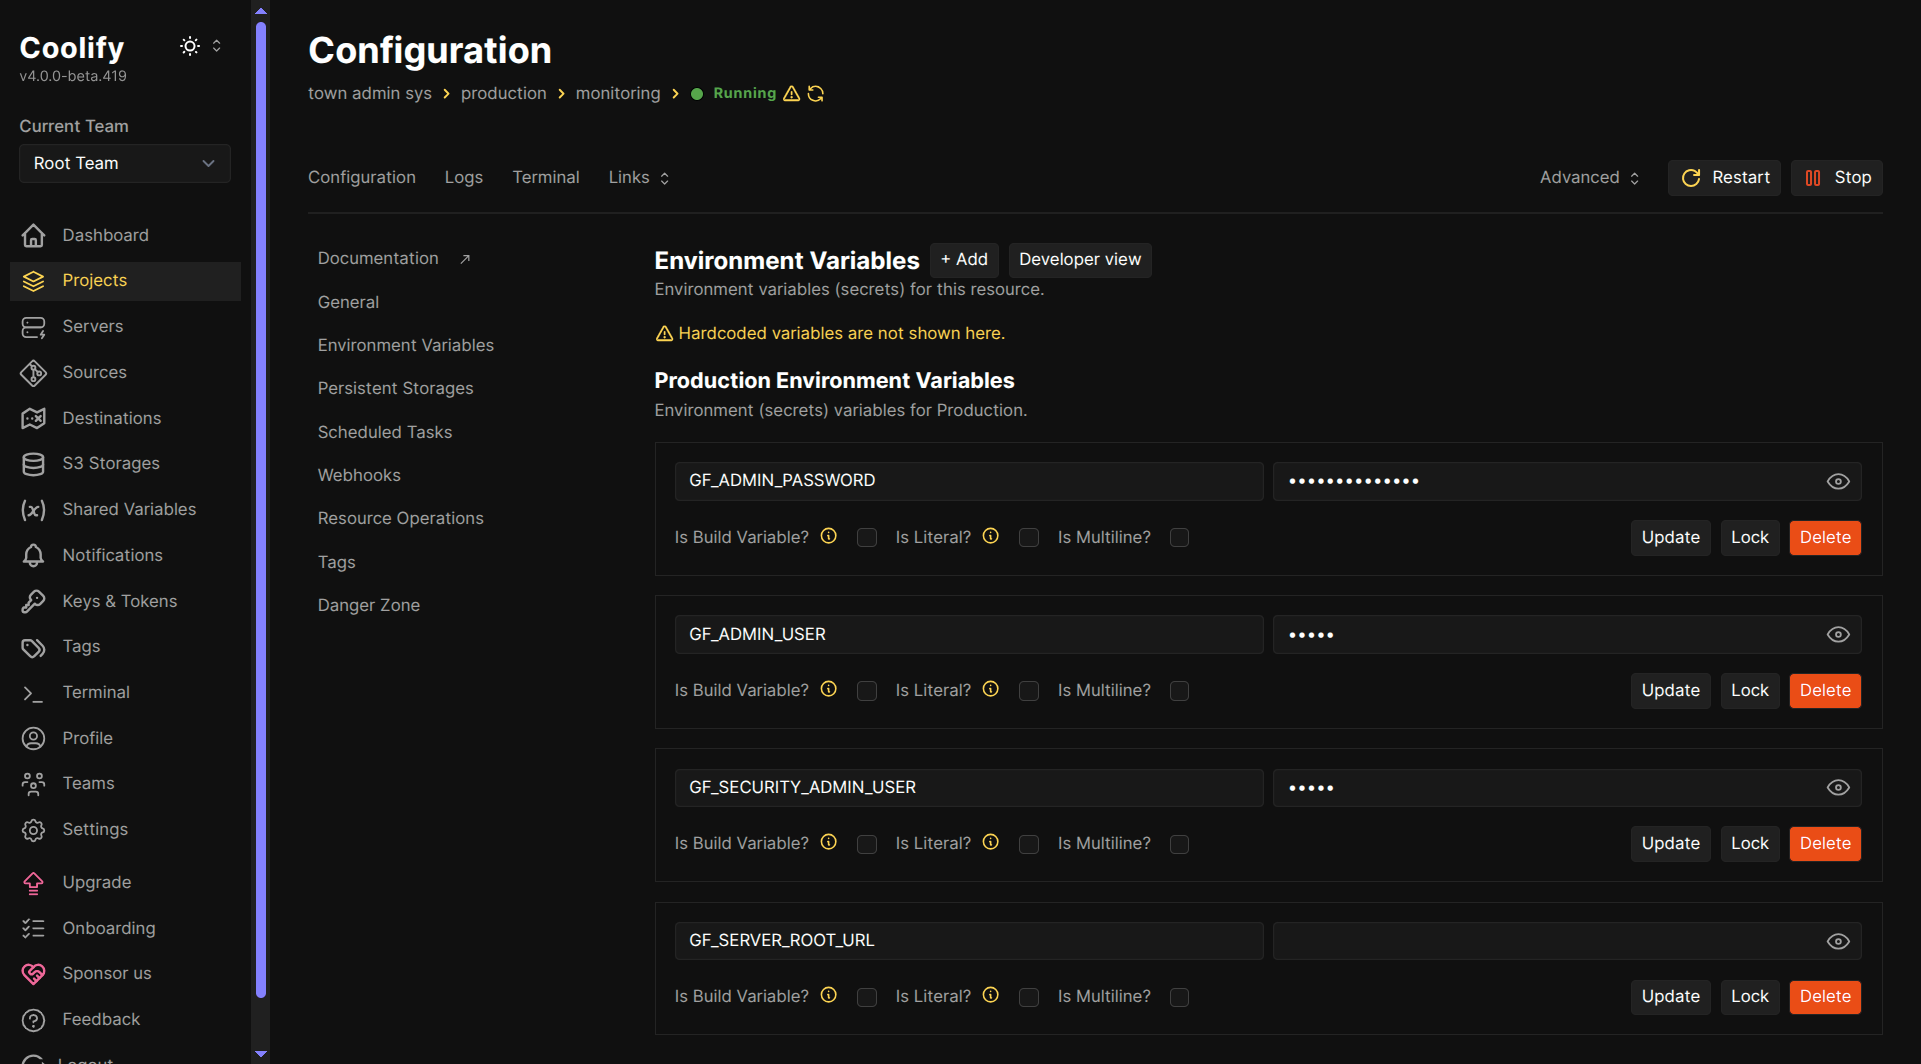
Set Environment Variables for Monitoring Stack
These variables are primarily for securing and configuring Grafana.
In the monitoring service configuration, go to Environment Variables section and add:
GF_ADMIN_PASSWORD=your-secure-password
GF_ADMIN_USER=admin
GF_SECURITY_ADMIN_USER=admin
GF_SERVER_ROOT_URL=
Deploy Monitoring Stack
Click the “Deploy” button. The services will start.
Note: It is common for services to appear “running (unhealthy)”. Unhealthy state. This doesn’t mean that the resource is malfunctioning. More info in Coolify Docs “Health checks”
Step 3: Connect Next.js App to Monitoring Stack
Now we ensure the application container knows how to find the monitoring containers.
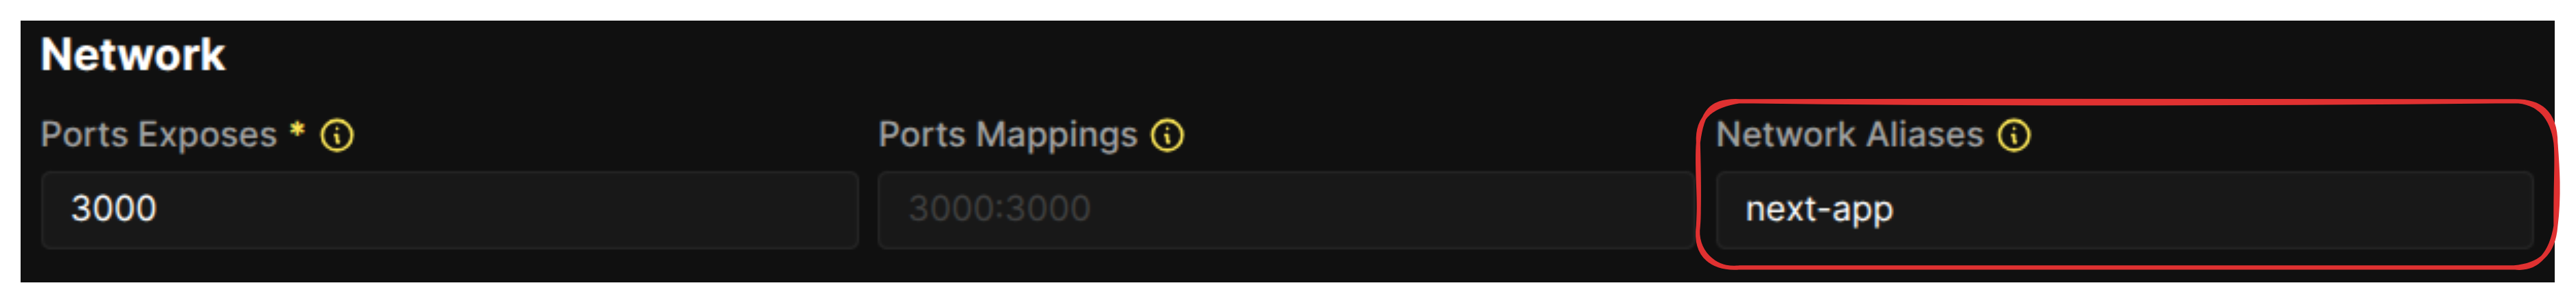
Add Network Alias to Next.js App
In the Prometheus config (prometheus_config content above), we instructed Prometheus to scrape the Next.js app at next-app:3000. This means the Next.js container must have the network alias next-app.
This is the crucial step that makes Prometheus scraping possible! In your Next.js application configuration in Coolify, scroll down to the “Network” section and add the alias: next-app.
Add Environment Variables to Next.js App
Finally, we inject the environment variables that tell the Next.js application where to send its logs and traces. We use the service aliases defined in the docker-compose.yml (loki, otel-collector).
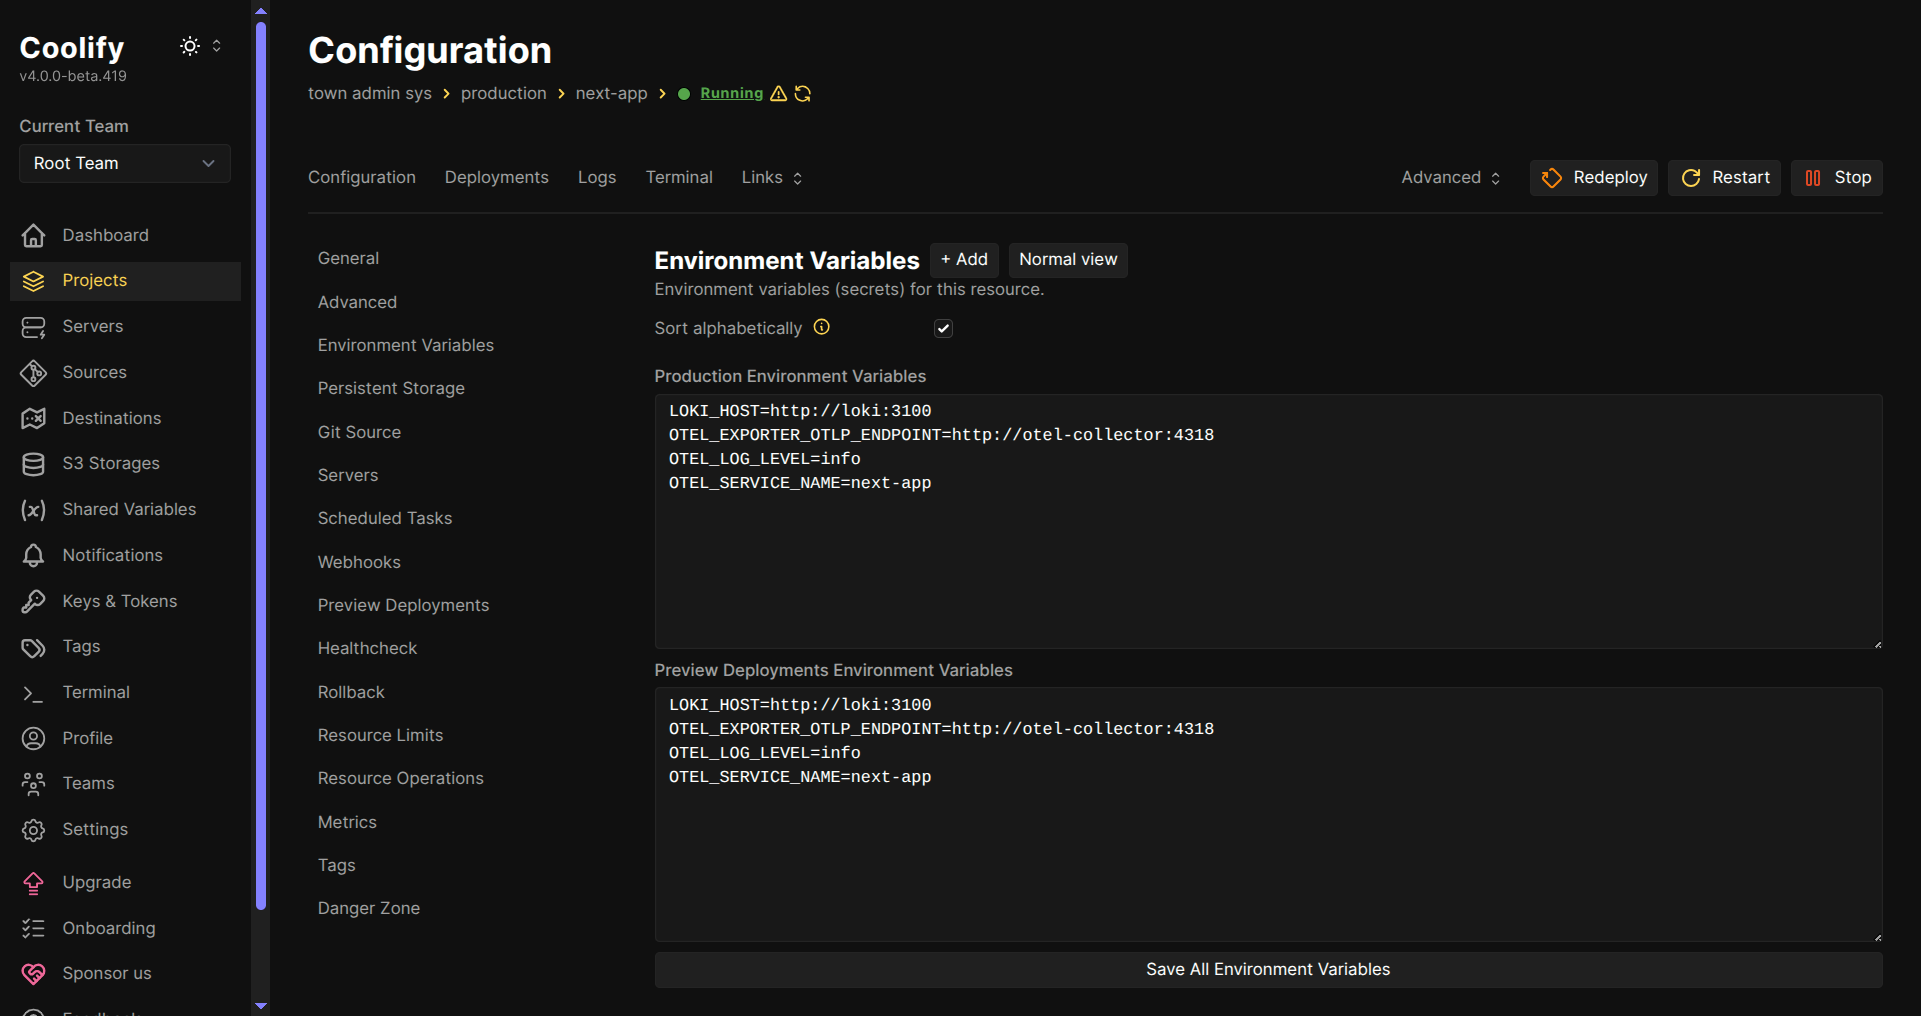
In your Next.js app configuration in Coolify, go to Environment Variables and add:
LOKI_HOST=http://loki:3100
OTEL_EXPORTER_OTLP_ENDPOINT=http://otel-collector:4318
OTEL_LOG_LEVEL=info
OTEL_SERVICE_NAME=next-app
Restart Services
- Restart Next.js app - This ensures the application picks up the new environment variables and network alias.
- Restart monitoring stack - This ensures the monitoring services pick up any lingering changes.
Wait for both services to come up.
Step 4: Verification and Visualization
Test Service Communication
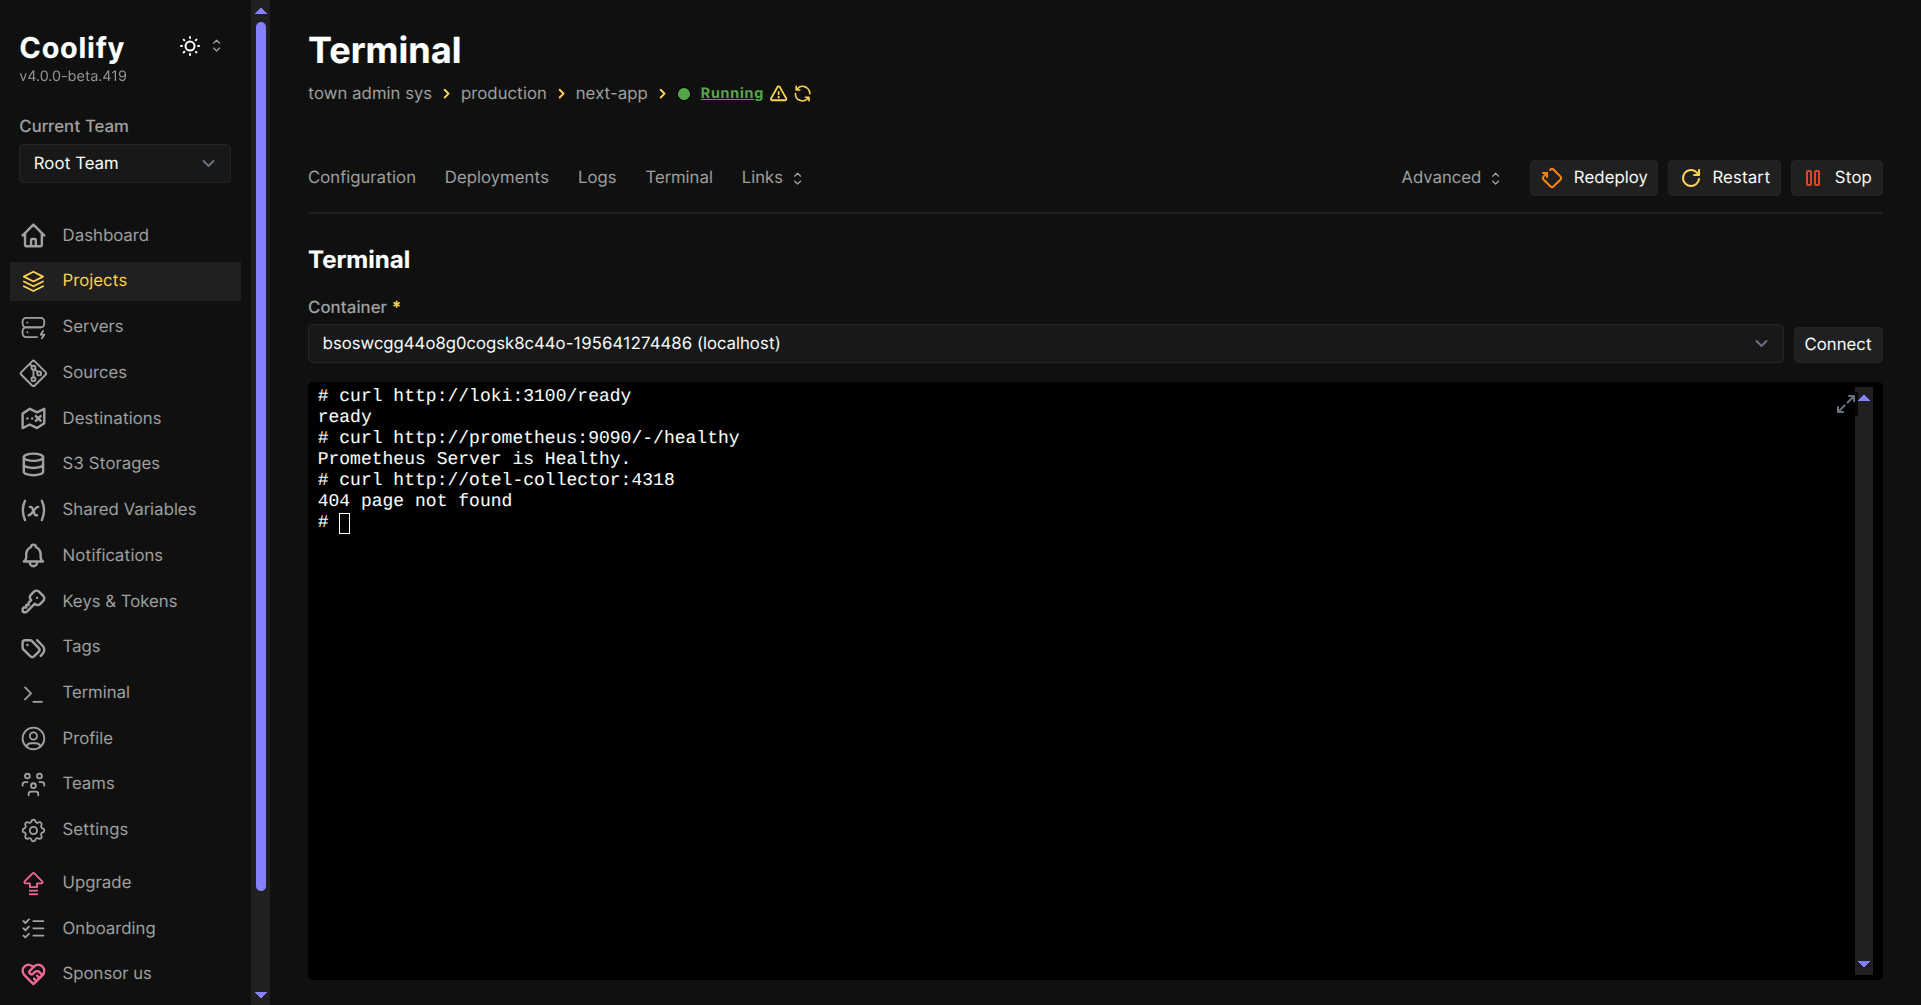
Use the Next.js app’s terminal in Coolify to verify network connectivity to the monitoring stack:
# Test Loki
curl http://loki:3100/ready
# Should return: ready

# Test Prometheus
curl http://prometheus:9090/-/healthy
# Should return: Prometheus Server is Healthy.

# Test OTel Collector (404 is expected for root path, indicating it is running)
curl http://otel-collector:4318
# Should return: 404 page not found
Verify Health Endpoint (Optional)
If you implemented the optional health endpoint, check it. It should show the environment variables were correctly received:
{
  "status": "OK",
  "timestamp": "2025-11-03T16:49:29.362Z",
  "monitoring": {
    "metricsRegistry": true,
    "logger": true
  },
  "env": {
    "otelLogLevel": "info",
    "otelServiceName": "next-app",
    "otelExporterOtlpEndpoint": "http://otel-collector:4318",
    "lokiHost": "http://loki:3100",
    "nodeEnv": "production"
  }
}
Step 5: Set Up Grafana Access
Expose Grafana with a Domain
To make Grafana securely accessible outside of Coolify’s proxy, we expose it via a dedicated subdomain with SSL.
- In your Monitoring service, click on the Grafana service’s Settings.
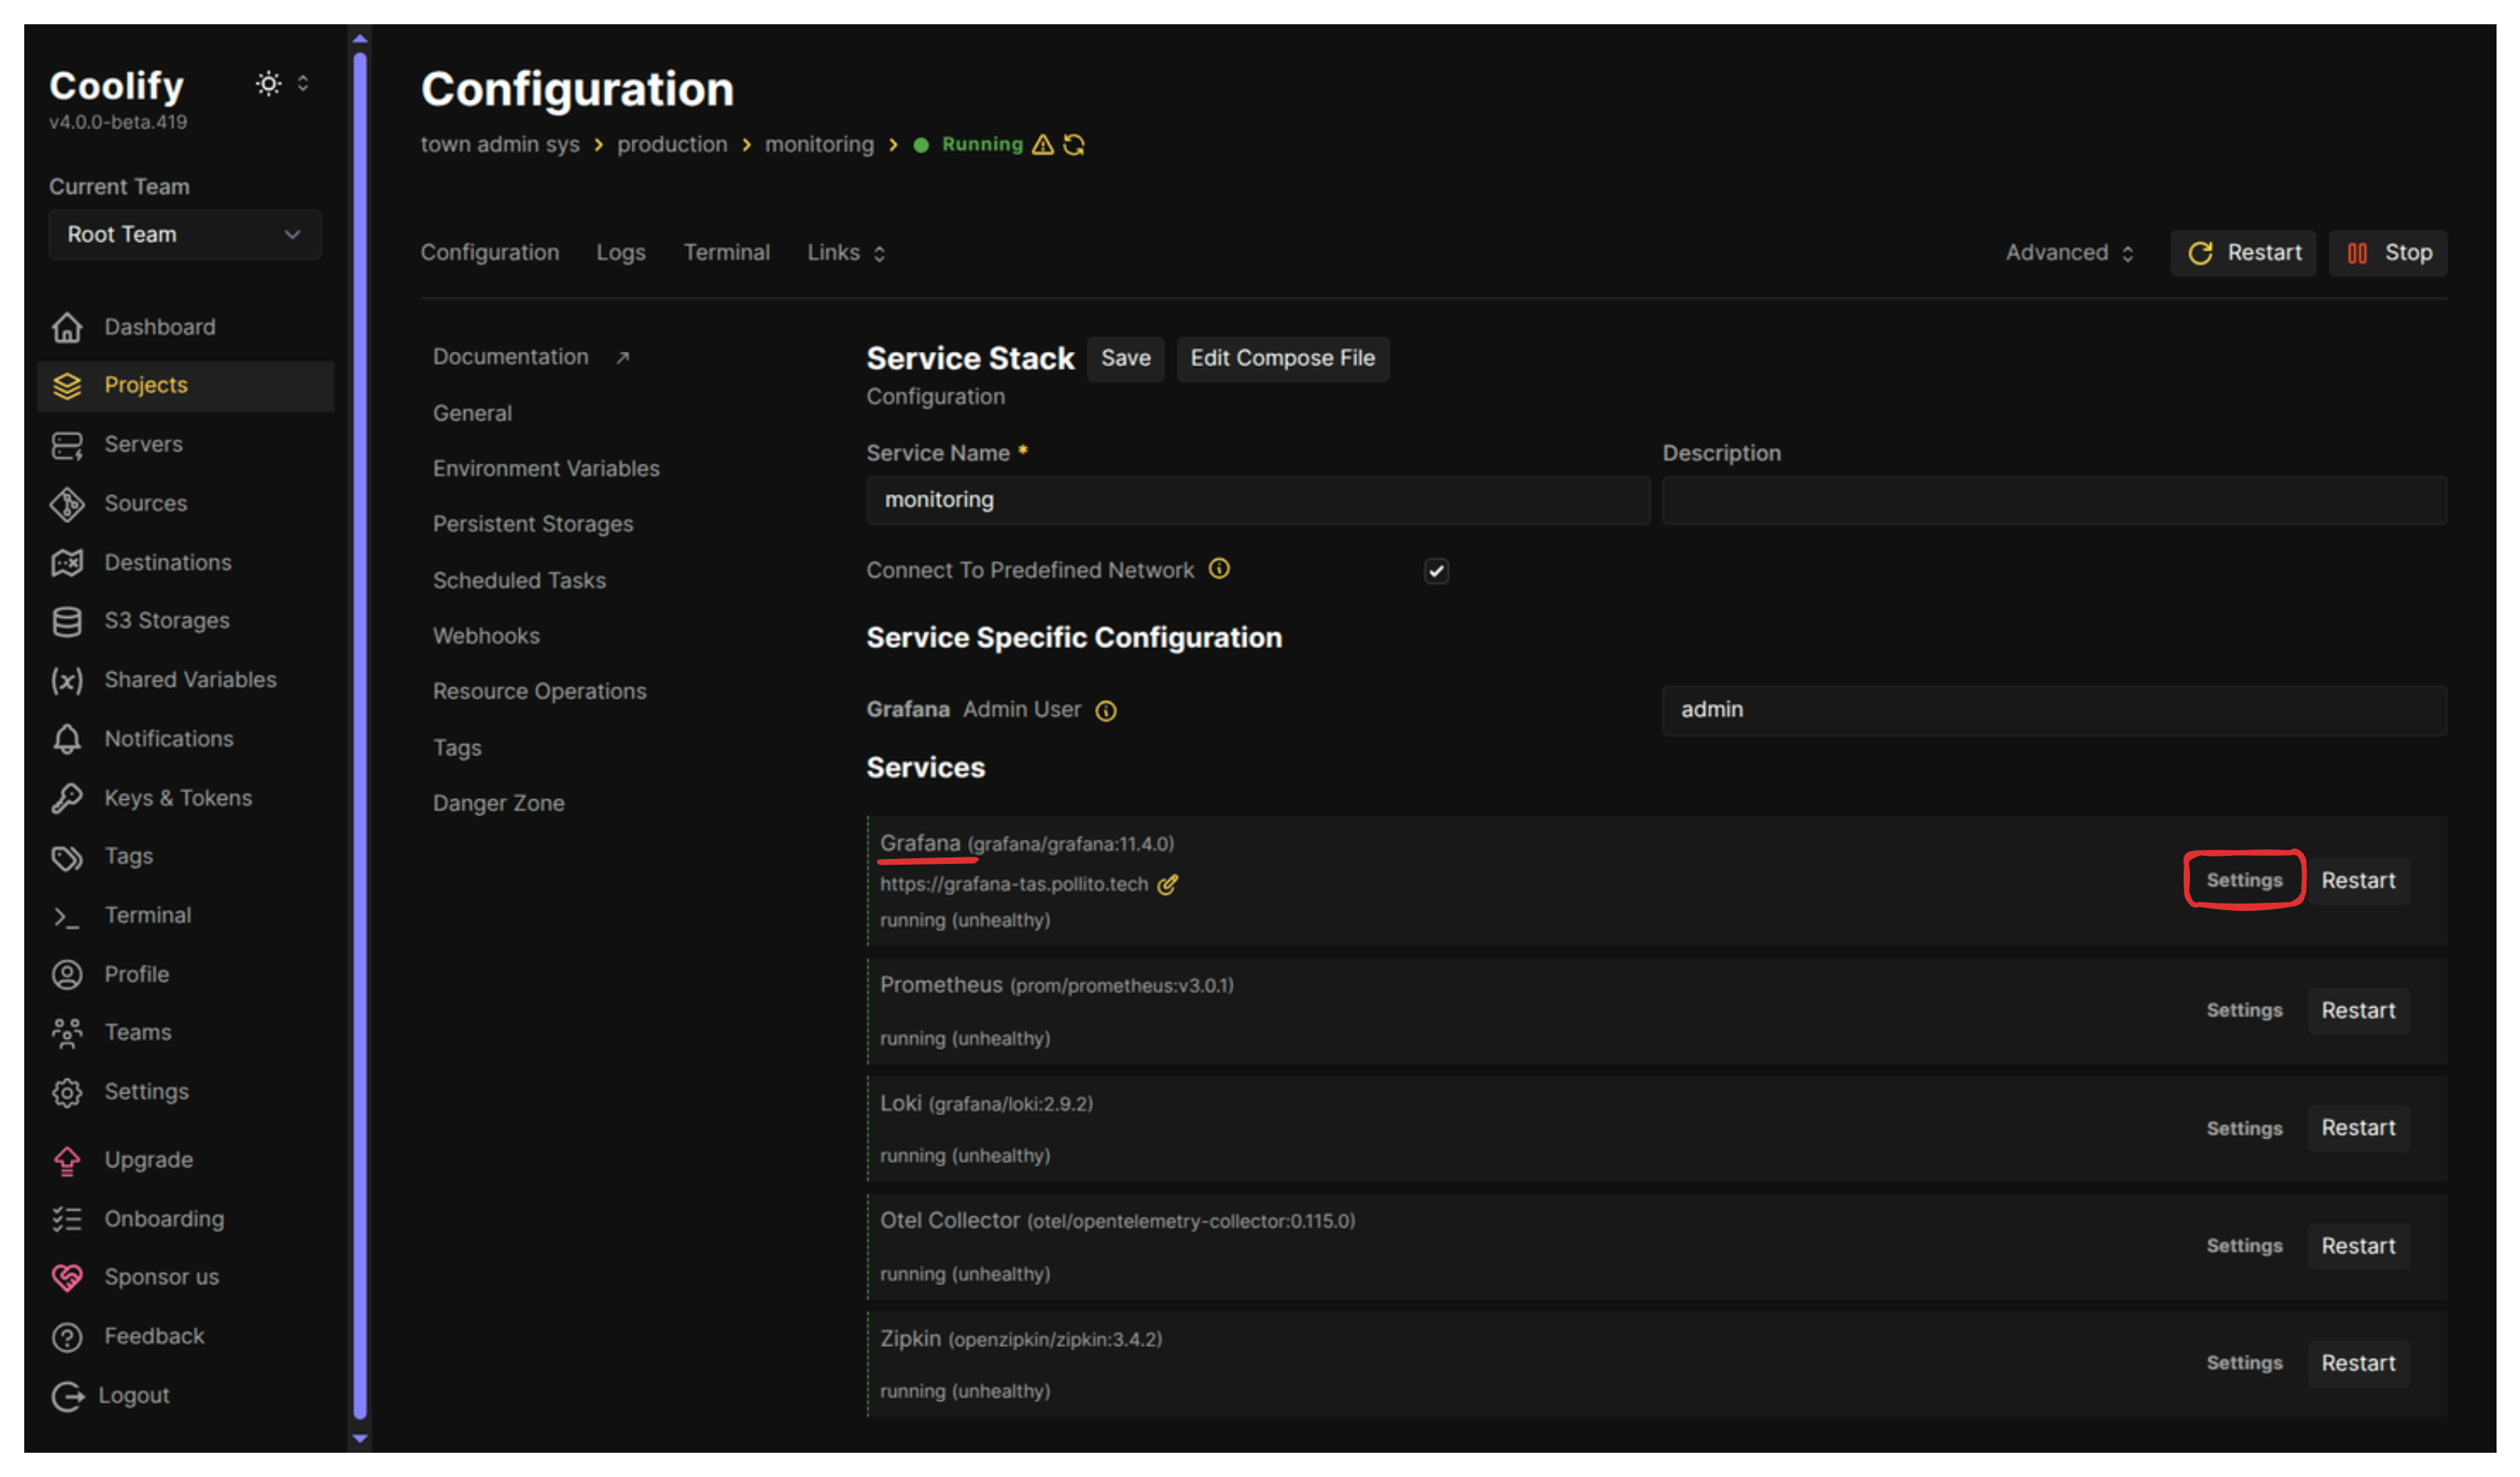
- Go to the Domains section. Enter your desired monitoring subdomain (e.g.,
https://grafana.yourdomain.com) and Save. Coolify handles the necessary port routing and sets up SSL with Let’s Encrypt.
Access Grafana and Configure Data Sources
- Go to your new Grafana domain (e.g.,
https://grafana.yourdomain.com). - Login with the credentials defined in the environment variables:
- Username:
admin(or what you set inGF_ADMIN_USER) - Password: (what you set in
GF_ADMIN_PASSWORD)
- Username:
Now you can configure the data sources and import a dashboard just as we did locally (Refer back to the previous post for detailed configuration steps.)
What’s Next?
With robust insight into our application’s health, performance, and behavior, we will take a moment to implement error handling, allowing the user to recover gracefully when something inevitably goes wrong.
Next Blog: Large Software Projects: Handling Errors